In today’s blog we’re going to talk about housing inventory in the United States Vs. housing inventory in San Jose, California. It’s the number one need in the market right now. The spring market that we’re heading towards certainly looks like interest rates will not be the thing holding people back. By and large it will be the number of available homes that are out there.
Two Dynamics Keeping Existing Home Inventory Low
According to Mark Fleming Mark from First American. He says, “Two dynamics are keeping existing-home inventory historically low, rate-locked existing homeowners and the fear of not finding something to buy.”
One dynamic is rate lock relative to the mortgage, this is somebody that maybe at 2.34%, or 3% that says, “Why we want to move with this interest rate?” I don’t think that’s going to prohibit everybody from moving. But there certainly is a block of people that are in that position that are just kind of staying put.
And the other is, “We don’t want to put our home on the market right now because we don’t know where we would go.” That’s been an issue over the last couple of years, but it’s going to become a bigger and bigger issue as we go through this year. Another factor is foreclosures, they’re not flooding into the market like many predicted, maybe a year or two ago, even through COVID and coming out of COVID, it’s just not happening.
U.S Average Annual Home Inventory from 1999-2022
The inventory is what’s kept prices from falling dramatically across the country. This is a look at inventory going all the way back to 1999, kind of humming along. And then we know inventory went up during the housing crisis.
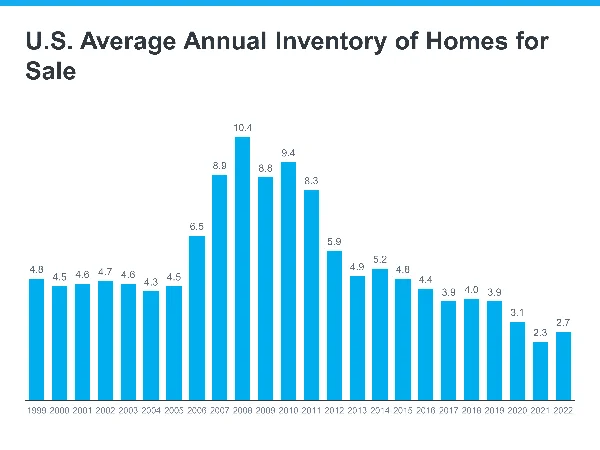
Since the housing crisis, inventory has sort of been on this downward trajectory, it’s been depleted. And certainly that was the case during COVID when everybody rushed in, the meaning of home changed and everybody wanted to buy a home during that time. So we’re starting to try to come of that whole that kind of bottomed out there.
Across the United States average the amount of inventory in 2021 was 2.3 months of inventory. In 2022 it was 2.7 months.
San Jose Average Annual Home Inventory 2018-2022
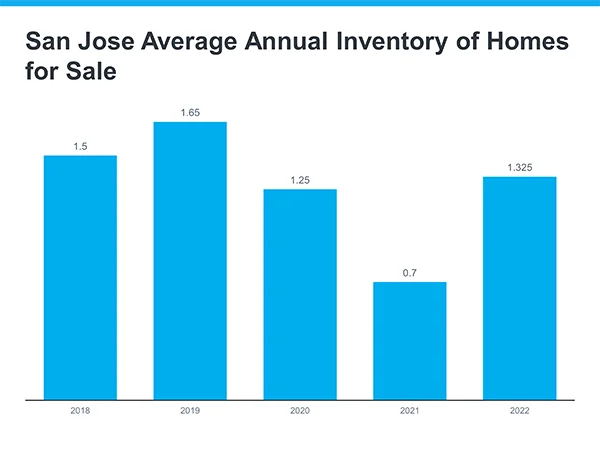
Comparatively in San Jose, CA, the average amount of inventory in 2021 was less than one month. In 2022 it was 1.325 months of inventory.
U.S. Months Of Home Inventory in 2022
As interest rates started to rise, we saw inventory grow, not from people putting their homes on the market, but homes staying on the market a little bit longer. This is a look going back through the last year of what happened each month in this country relative to inventory.
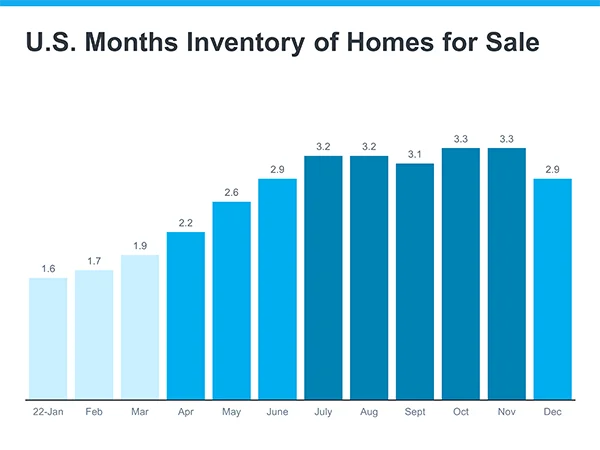
But what happened in December? See a little bit of a chunk down. And what are we seeing in January? There just simply isn’t enough inventory out in the market for those that want to buy. We know a lot of people took their homes off the market in the later months of the year because of the holidays, and a number of different reasons.
San Jose Months Of Home Inventory In 2022
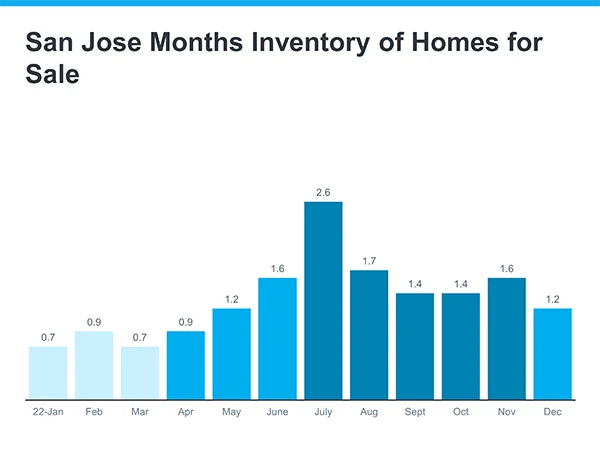
In San Jose the average months of inventory was 1.325 in 2022. Clearly faster than the rest of the United States at 3 months of inventory. Lack of inventory, demand for housing & employment continue to keep the monthly supply of homes low.
U.S. Active Listings Vs. New Listings Year Over Year
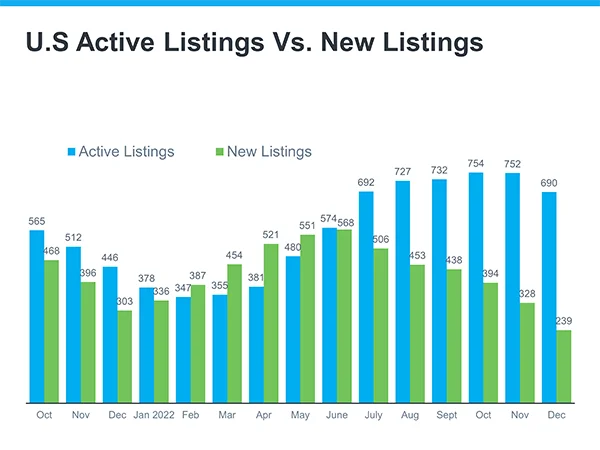
This is a look at new listings as we started out 2022 and went through January, February, March, April and May, and sort of the line there was, listings are going to continue to grow, and that’s going to compromise prices.
San Jose Active Listings Vs. New Listings
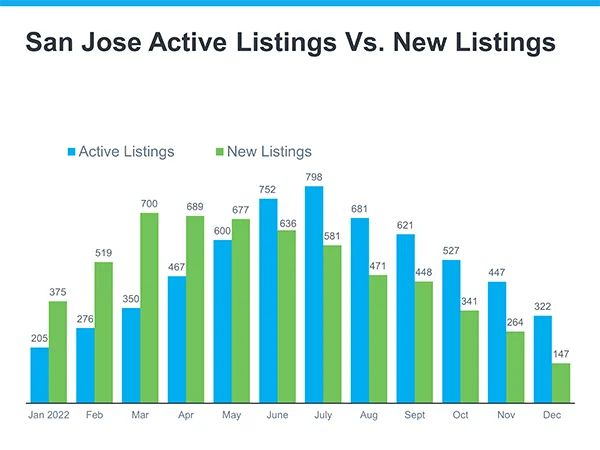
In San Jose the amount of active listings increased in May to 600 then over took the amount of new listings in June. Since June, the amount of active listings increased, however new listings began to decline and have continued to do so through the year.
There was a sentiment that if they’re growing this fast, imagine where we’re going to be in the fall. And that’s what a lot of people said when they made their case for falling prices in this country. Well, what’s the reality?
U.S. New Listings Over The Years
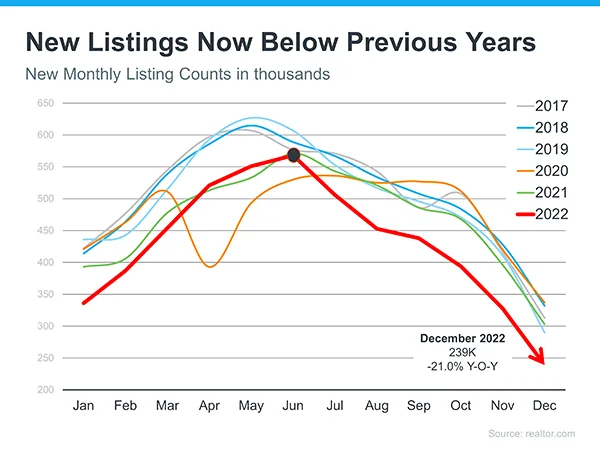
The reality is that inventory sort of took this nosedive. New listings coming to market are less than in 2017, 2018, 2019, 2020 and 2021. You see each one of those years sort of graph their peaks in the spring and starts to fall off throughout the year. That’s the seasonal trajectory that housing and new listings take.
In December of this past year, 239,000 new listings in the United States. That’s down 21% year-over-year. So inventory is growing, but is down significantly. The reason inventory is growing is homes sitting on the market that maybe need a price adjustment, maybe need something done cosmetically, maybe there’s something going on there. But if something is priced right, it sells.
San Jose Number Of New Listings
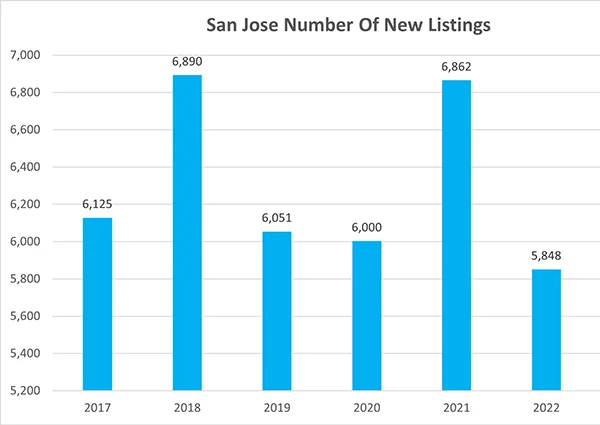
The number of new listings in San Jose has steadily remained above 6,000 homes from 2017 till 2021. In 2022 the amount of new listings dropped below 6,000 to 5,848 homes. This trend is expected to continue as negative factors such as layoffs and the increase of interest rates are expected to put a hamper on the amount of homes for sale.
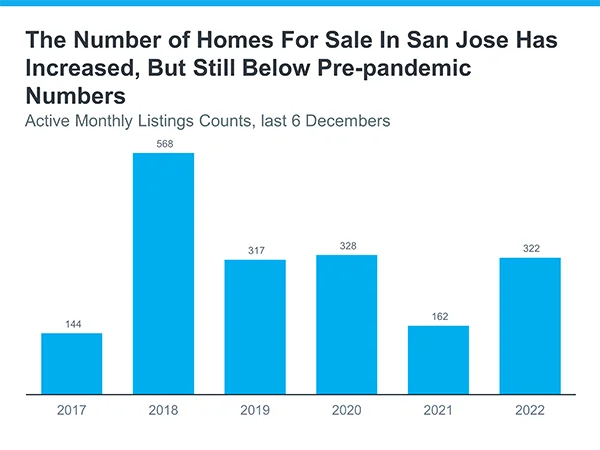
Number Of Homes For Sale In The U.S. Vs. San Jose
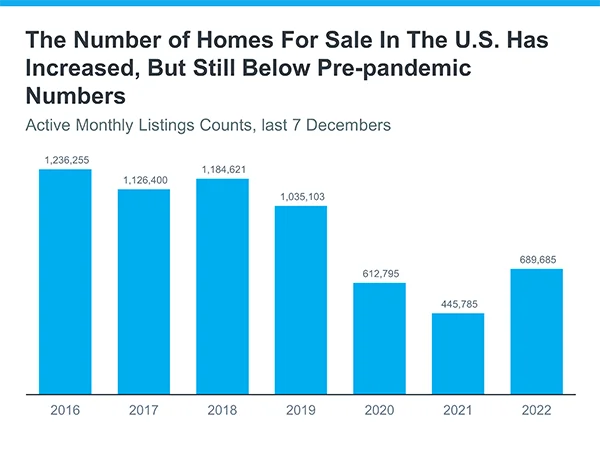
If you look at the number of homes that are for sale, it’s increased, but we are still below where we were.
Insights From Housing Experts
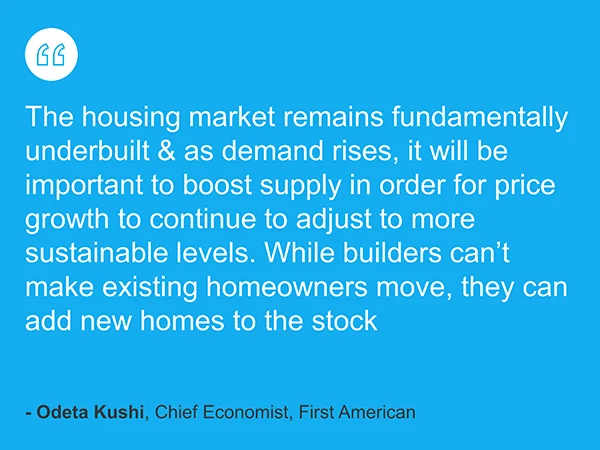
Quote from Odeta Kushi, “The housing market remains fundamentally underbuilt” let me repeat that. “The housing market remains fundamentally underbuilt, and as demand rises,” It will be important to boost supply in order for price growth to continue to adjust to more sustainable levels. While builders can’t make existing homeowners move, they can add new homes to the stock.”
The number of new builds that we didn’t have over last ten years that have led to this issue of being underbuilt in this country in residential real estate. That’s always going to keep upward pressure on prices. When we don’t have enough supply, you have people that want to buy, that pushes the price up.
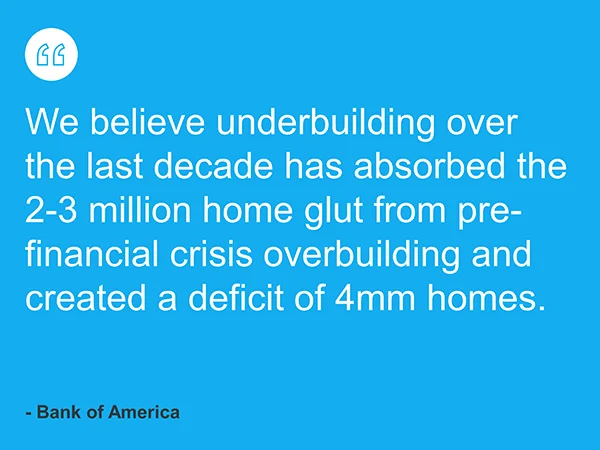
And that was the story during the pandemic that was fueled by historically low interest rates. Everybody rushed in, pushed the price up, but no doubt we remained underbuilt in this country. This is a quote from Bank of America, “We believe underbuilding over the last decade has absorbed the 2-3 million home glut from pre-financial crisis overbuilding and created a deficit of 4 million homes.”
Experts Forecast Housing Shortage Across The U.S.
This is a great graphic that breaks down each one of the forecasters and what they think.
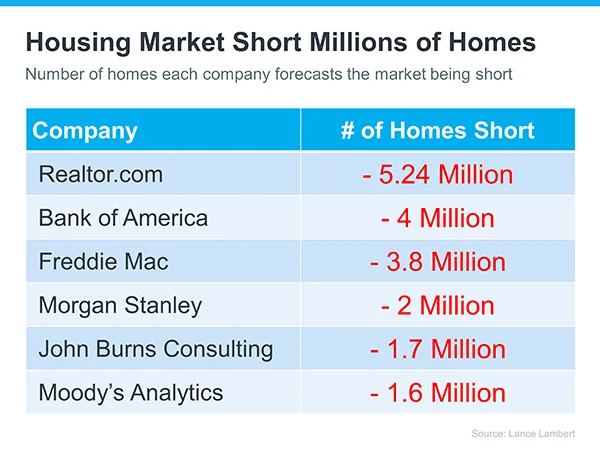
The bottom line is we need more inventory for those that want to buy. And that’s the thing that’s kept pressure on prices through the last six months, rising interest rates and what that has done to demand.
Read Also: