Housing Market Inventory Nationwide continues to rise over the summer. A lot of that has to do with buyer demand and active homes for sale, referred to in the real estate market as “active listings”. We’ve put together a series of reports that detail how the increase nationwide of housing market inventory has affected home showings, new listings, overall active listings, and concessions for home buyers.
Table of contents

How has increased housing market inventory improved conditions for buyers.
Buyers who have potentially been sitting on the sidelines or stepped out of the process because they couldn’t find a home or it was really competitive, now may be a great time to jump back in with more options available and more time to consider them not feeling so rushed.
This is a very different market than what we were talking about even just a few months ago. The frenzy of the pandemic is truly behind us.
The Effect On Home Showings Year Over Year
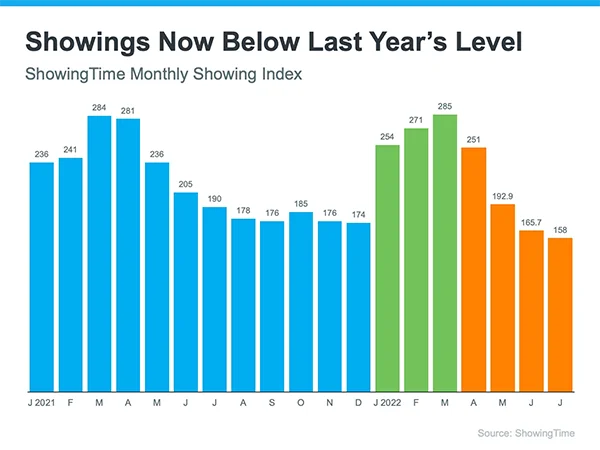
Showings are now below last year’s level. this is, is a measure of how many people are going out and looking at homes right now.
ShowingTime puts together a monthly index, and what we’re showing you here in this index, is May, June, July, we’re seeing that buyer demand start to soften and cool a little bit.
Why is that? how rising mortgage rates have really softened what’s happening with buyer demand, a little bit of a cooling on buyer demand.
And so we’re seeing fewer buyers, in the market right now. context is important
not as many buyers as the past year, but let’s talk about what happens compared to pre-pandemic numbers
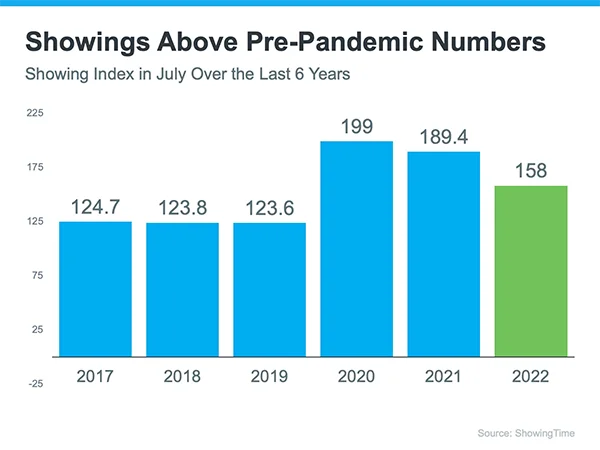
Home Showing Trend Over The Last 6 Years
If we look at July over the last six years, and July is the latest data we have here, if you look at the ShowingTime index for July of 2022. There is certainly a drop off from 2020 and 2021 compared to this year.
But we’re still ahead of those pre-pandemic years. remember, those were great years in real estate. showings above pre-pandemic numbers.
So has buyer demand softened a bit? Yes Is the frenzy behind us? Buyers haven’t completely disappeared, they’re still eager to find a home.
How Home Buyers Have Affected The Nationwide Real Estate Market
What does that mean?
If there are fewer buyers in the market, that’s softening buyer demand, that’s softening home sales, and that creates more inventory.
So not as many buyers means inventory is actually growing. So more options for the buyers who are staying in the market.
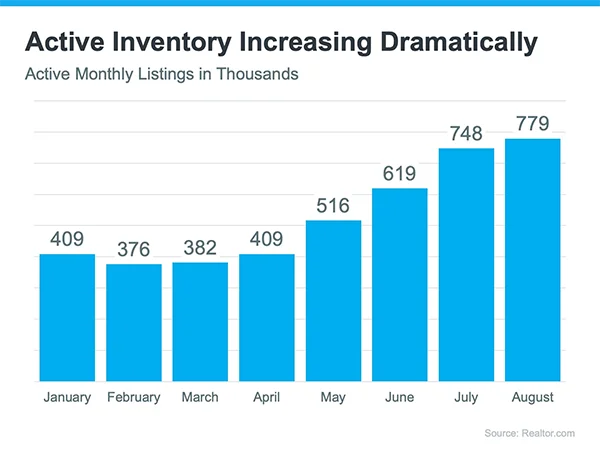
This is the latest active inventory, and it shows that it’s increased dramatically since the beginning of this year. active monthly listings in the thousands. You can see how it’s really ticked up in May, June, July, August–at the same time that that buyer demand was softening.
So fewer buyers, more inventory. This is creating a very different dynamic in our housing market, and we can see how this active inventory is rising.
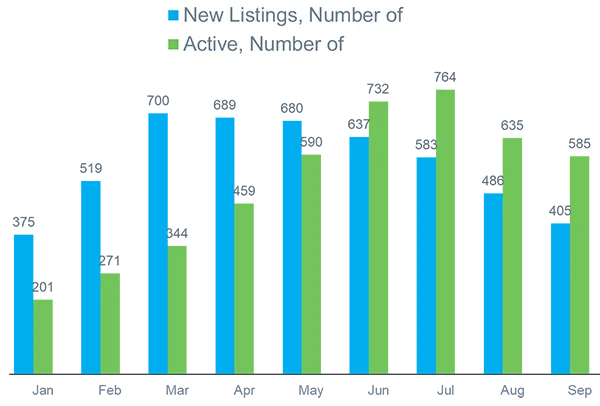
And the interesting thing, is that inventory overall is not just coming from new listings. You may think more inventory means more people are listing their home.
Active Listings versus New Listings Nationwide
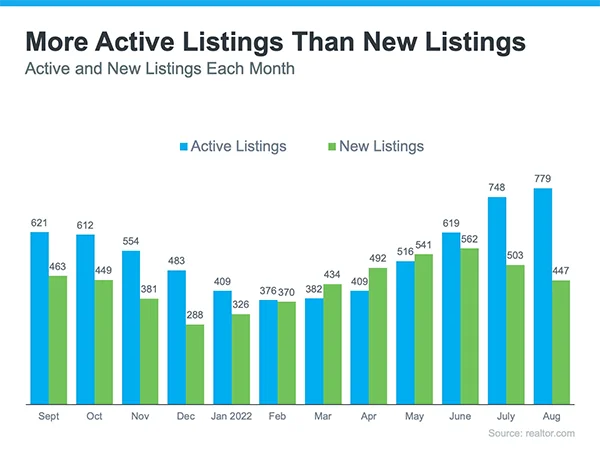
So let’s break down the nationwide housing market inventory into active versus new listings for a moment. We actually have more active listings than new listings. That’s the trend in the market right now. So the green bars are new listings coming to the market, and you can see in June, July, August–that number has kind of tailed off a little bit.
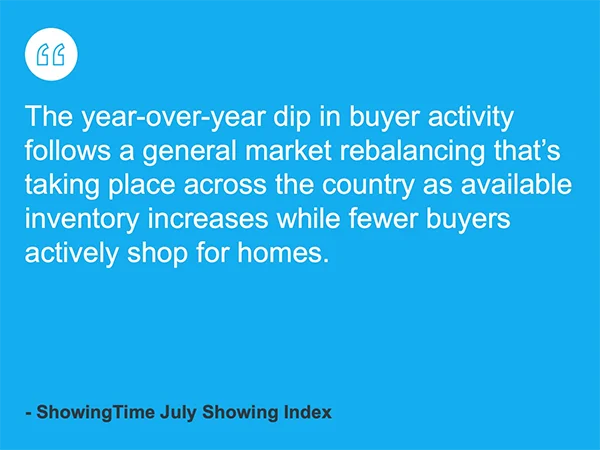
There are not as many new listings coming to the market, but active listings. What this means, is that homes are staying on the market a little bit longer. Just like we saw in that quote in the beginning, active listings are growing, creating more options for buyers.
San Jose Housing Market Inventory Versus Nationwide Inventory
San Jose started to see an increase of active listings starting in March until it peaked in July. 20% of the home buyers were lost during that time. Home buyers returned to the market in July and continue to do so despite being on the cusp of a sellers market.
With the recent increase in interest rates, home sellers must price their home correctly and be prepared to offer some kind of interest rate buy down or closing cost concession. These concessions should help homebuyers from being spooked out of the market.
While the rest of the United States transitions to a potential buyers market, the real estate market in San Jose is likely to transition to a balanced market. The rate of appreciation may slow, though dramatic price drops are not expected because the demand for housing outweighs the supply in San Jose.
Year Over Year Inventory Changes Nationwide
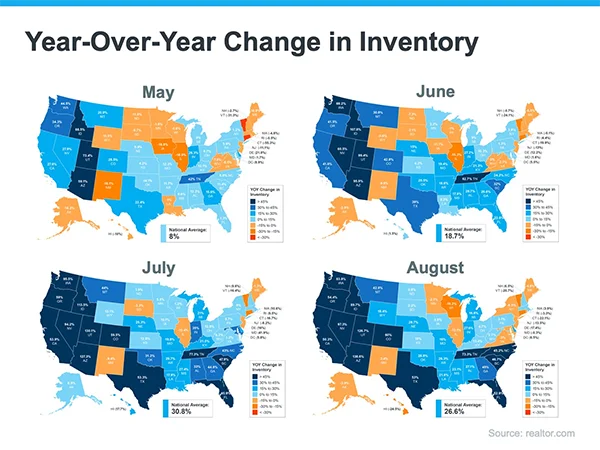
Let’s take a look at this from a map view. This is year-over-year change in inventory. What this shows here, is that the darker the states get, the more inventory is available.
What happens year-over-year May, June, July, and now you’re looking at August.
August shows that we have 26.6% more inventory this August than we did last August.
If you think back to last year, where buyers were still clamoring for endless bidding wars, it was extremely competitive.
Buyers have more options right now because overall buyer demand is softening, sales are softening, and we’re seeing that create more active listings on the market.
So, what does this mean? This is something that is creating opportunities for buyers.
Home Seller Concessions
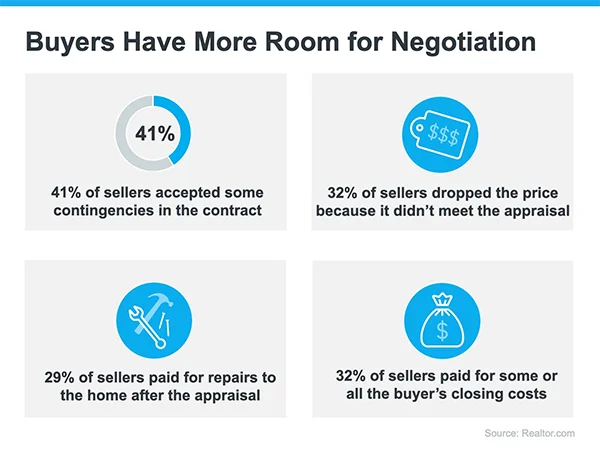
According to the latest survey data from Realtor.com. Buyers have more room for negotiation, 41% of sellers accepted some sort of contingencies in their contract.
This survey was done recently over buyers or sellers who sold over the past year. It also says that 32% of sellers dropped the price because it didn’t meet the appraisal. more contingencies coming back, sellers negotiating a little bit more with the appraisal price when that comes in.
29% of sellers paid for repairs to the home after the appraisal that’s an increase that we’re seeing as well. And 32% of sellers pay for some or all of the buyers closing costs.
Concessions that we weren’t seeing in the market a year ago are starting to evolve in the buyer’s favor.
Now, that does not mean that we are in a buyer’s market. We are still squarely in a seller’s market, but buyers have a little bit more breathing room.
From a seller’s perspective, inventory is still historically low.

Home Inventory Challenges Remain
What you can see from this data from Calculated Risk, is that the latest data that we have ending the week of September 2nd.
So that last week in August into the first couple of days of September–we had 26.3% more inventory than that same week in 2021. Now, if you compare that to 2020, inventory is still lower than that, 5.4%.
And if you compare that to the same week in 2019, inventory is definitely still historically low, down 42.2%.
Inventory is still a challenge. We have about half the inventory we need to be even in a neutral market. right now, inventory is still historically low, even though there’s a window for buyers right now.
“While fewer new listings are entering the market, overall inventory continues to grow, providing more choices to buyers who are still shopping for a home.”
We should expect more choices for buyers this fall, a more moderate pace of home selling, more listings to choose from, and softening price growth will provide some breathing room for buyers searching for a home during what is typically the best time to buy a home.
See Also: A look back at the San Jose Real Estate Market In 2018 https://pedroromero.co/san-jose-real-estate-market-update-july-2018/
Sources:
1, 2, 3, 4, ShowingTime – https://www.showingtime.com/blog/july-2022-showing-index-results/
5, 6 Realtor – https://www.realtor.com/research/data/
7 Realtor – https://www.realtor.com/research/august-2022-data/
9 Calculated Risk – https://www.calculatedriskblog.com/2022/09/housing-september-5th-update-inventory.html
10 Realtor – https://www.realtor.com/research/august-2022-data/
11 ShowingTime & Move –
https://www.showingtime.com/blog/july-2022-showing-index-results/
https://news.move.com/2022-09-01-Realtor-com-R-August-Housing-Report-Days-on-Market-Grows-for-the-First-Time-in-Over-Two-Years
1 Response to "Nationwide Housing Market Inventory Update September 2022"
[…] Nationwide Housing Market Inventory Update September 2022 Pedro Romero Coldwell Banker The Professional Group San Jose Real Estate San Jose Real Estate Market Update […]