
In today’s blog, San Jose Real Estate Market VS. National Real Estate Market we take a detailed look at how the two markets compare as of August 01, 2023. We’ve highlighted 10 Key Indicators that will provide you with informed insights as to the speed, strength and demand of the real estate market locally and at a national level.
Total Listings
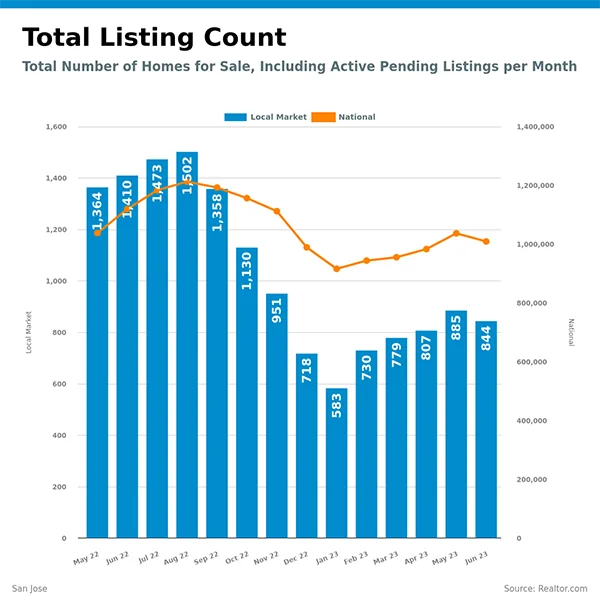
First we’ll take a look at how the total number of listings stack up. It’s a combination of new listings coming to the market this month, plus the ones that are still available from previous months.
Nationally in June we had just above 1,000,000 single family homes for sale. While in San Jose there were only 844 single family homes for sale. As we dive deeper into the data, we’ll take a look at active listings.
Active Listings
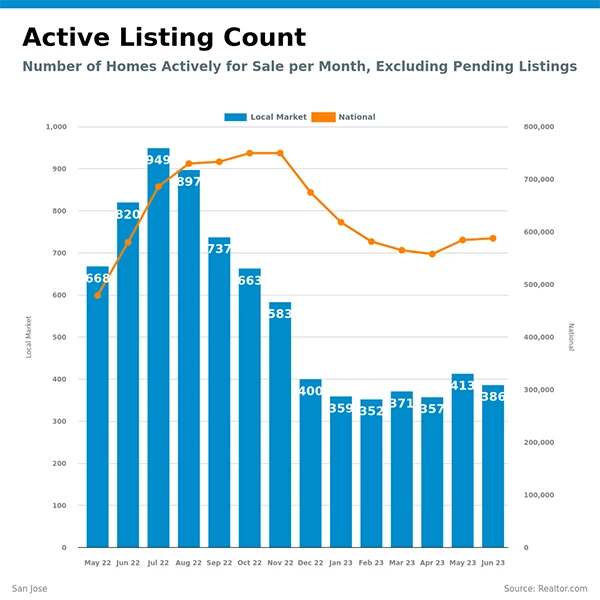
This graph gives you the details of how many houses are actively for sale. These are homes not yet pending or under contract.
Nationally we have just under 600,000 single family homes for sale. Moreover in San Jose, the amount of active listings averaged about 350 for most of the year then increased in May to 413. In June it decreased slightly to 386 listings.
New Listings
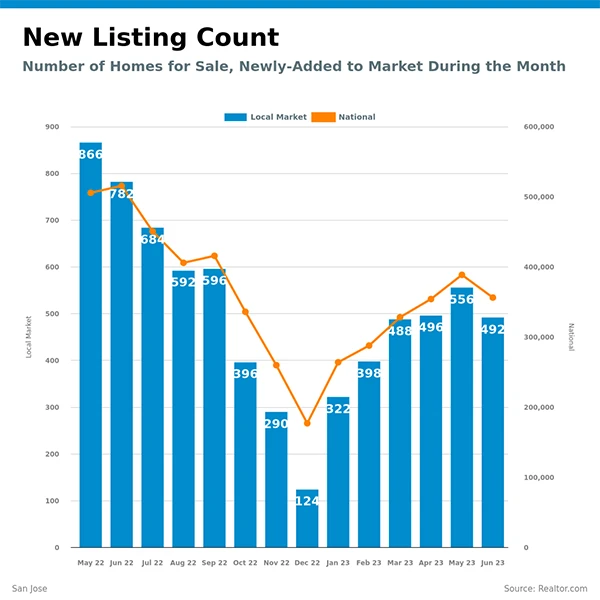
Here’s a graph that shows the number of homes that are newly listed, or just added to the market, within the last month. Nationally we had an increase of new listings starting in February and peaking around May of this year to just under 400,000. In June it decreased to just over 360,000 new listings.
Comparatively in San Jose, we experienced a similar increase of listings that peaked at 556 in May. In June there were 492 new listings.
Pending Listings
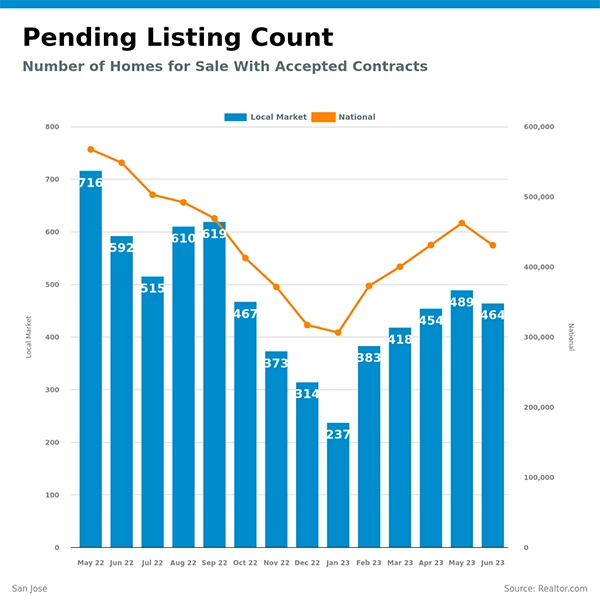
Nationally, we saw a steady increase of pending homes starting in February and apexing in May with just over 450,000 pending listings. Since May, the amount of pending listings decreased to 440,000 in June.
We see a similar result in San Jose with 383 pending listings in February and topping off with 489 pending listings in May. In June the amount of pending listings decreased to 464.
Median Listing Price
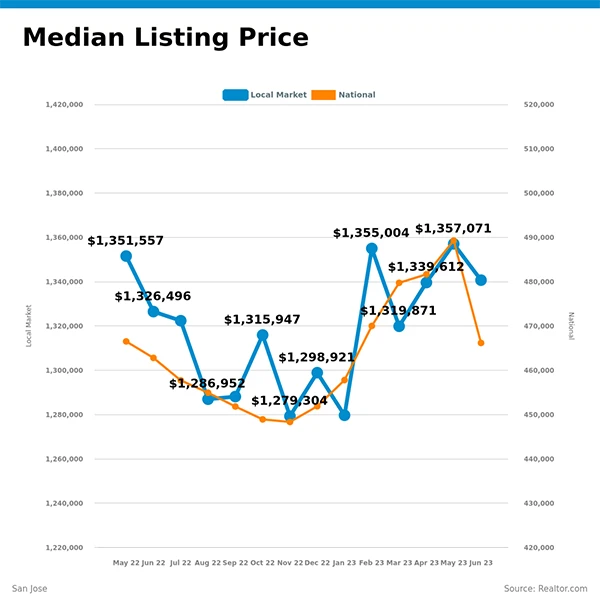
Across the nation the median listing price for a home started at about $452,000 in December 2002 and steadily increased till it peaked at around $490,000 in May. In June the median listing priced decreased to around $468,000. Meanwhile in San Jose the median listing price began its increase in January 2023 around $1,280,000. The median listing price decreased in March to $1,319,871 then peaked at $1,357,071 in May. The median listing price for a home in San Jose in June decreased to $1,340,000.
Median Listing Price Per Square Foot
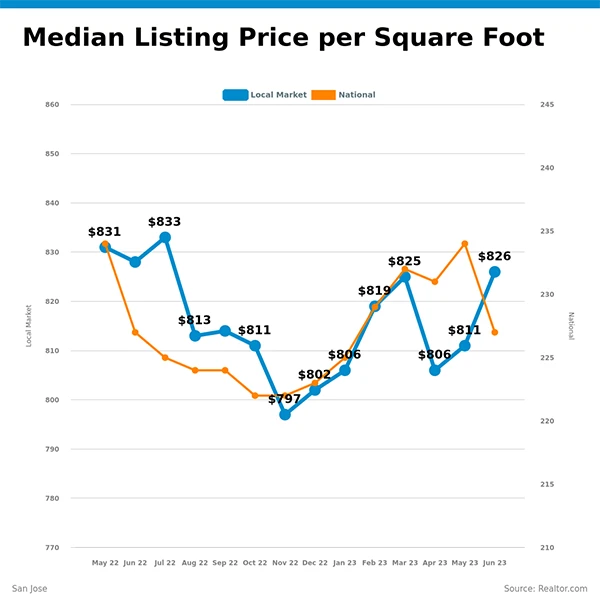
Nationally, the price per square foot for single family homes in June was just over $225 a square foot. Conversely in San Jose, the price per square foot continues to climb and rose to $826 a square foot in June.
Median Days On Market
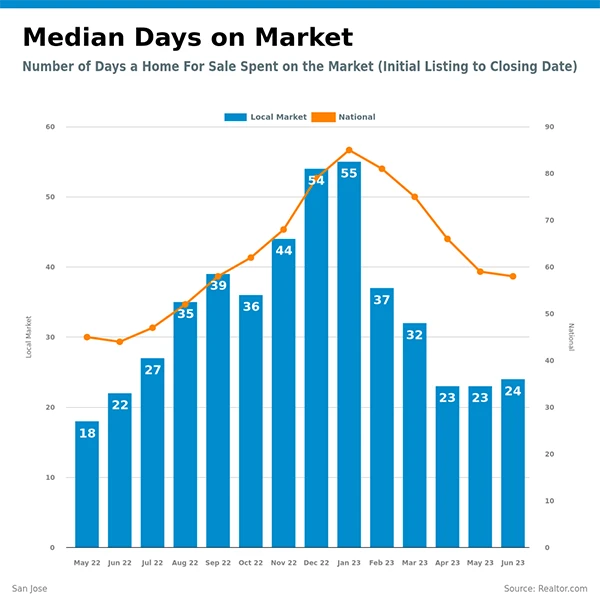
One question on the minds of many homeowners and home buyers is how long does it take for homes to sell? On the average, nationally it takes around 44 days for a home to sell. In San Jose it’s much faster at only 25 days to sell.
Number Of Homes With Price Reduction
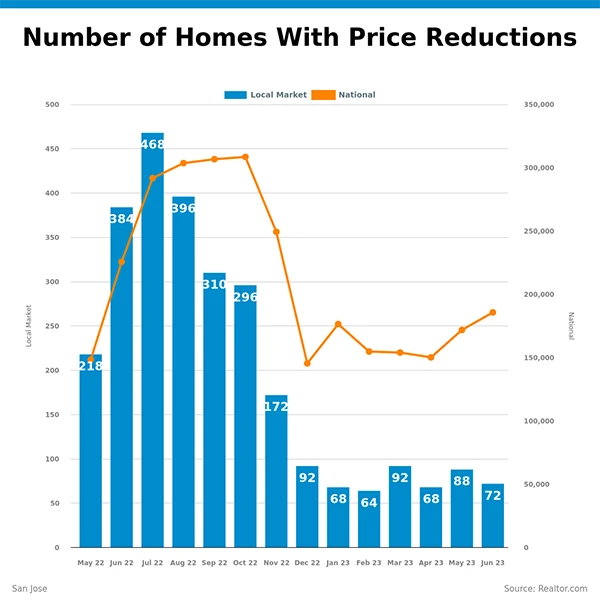
The number of homes with price reductions is on the rise Nationally. The increase began in April with just over 152,000 homes and has increased to about 180,000 in June.
In San Jose we see a steady number of homes with price reductions averaging around 64. The number of homes with price reductions peaked in March with 92 homes and has declined to 72 homes in June.
Median Home Square Feet
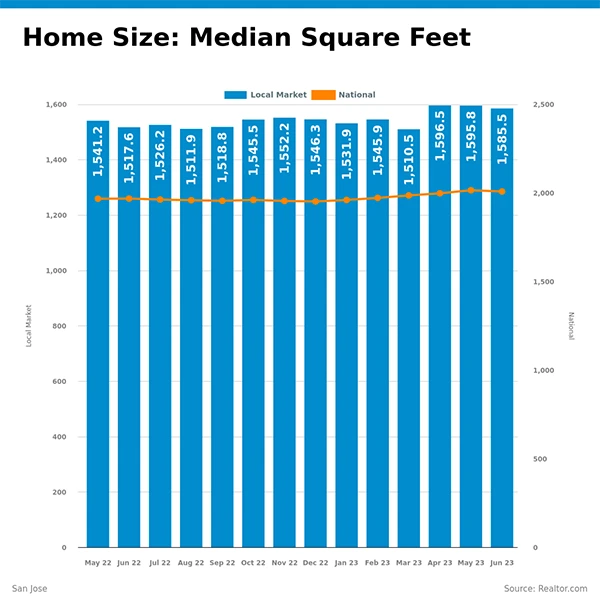
This graph shows the median square feet of local homes, so you can get a feel for typical size in our market.
Across the nation the median square feet of homes for sale has remained between 1,900-2,000 square feet from May 2022 to June 2023. However in San Jose the median square feet of homes for sale is lower, at about 1,540 square feet from May 2022 to June 2023.
Median Months Of Inventory
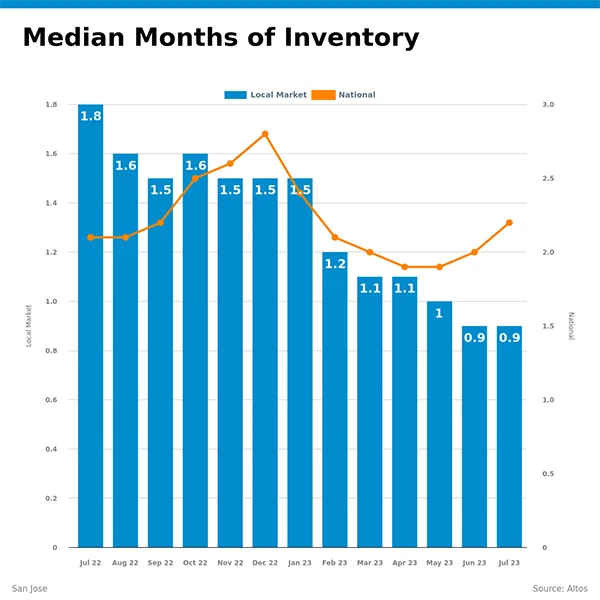
Nationally the median months of inventory continues to rise from 1.8 months of inventory in May 2023 to just over 2.2 months of supply in June 2023.
In stark contrast in San Jose the median months of inventory at the beginning of the year was 1.5 months. As the year progressed, the median months of supply decreased to .9 median months of supply. In addition, clearly faster than the rest of the United States at 2.2 months of inventory. Lack of inventory, demand for housing & employment continue to keep the monthly supply of homes low in San Jose.