San Jose Real Estate Market Update October 2017
In the San Jose real estate market, conditions continue to favor sellers, even as fewer houses become available compared to this time last year.
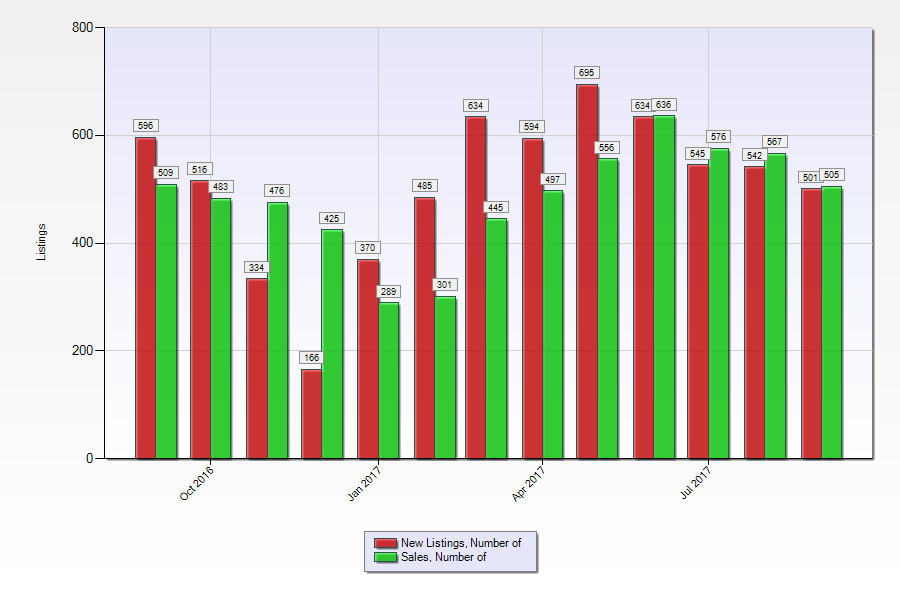
The 501 new listings in September 2017 represents a decrease over September 2016 with 596 listings.
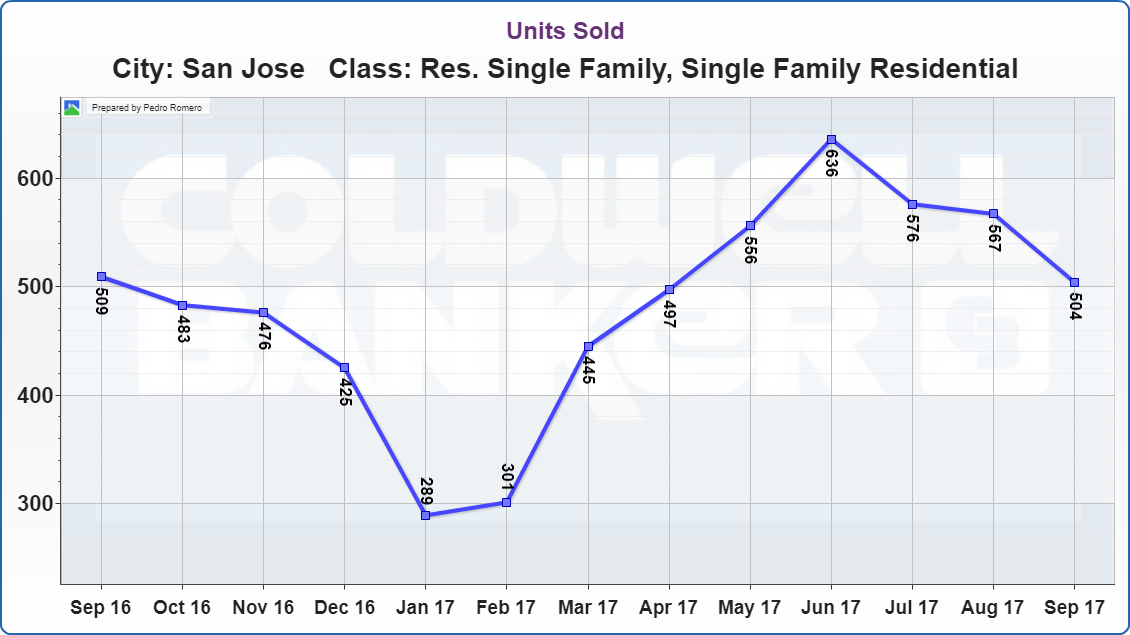
San Jose Real Estate Market Update Units Sold
The Multiple Listing Service reports that in September a total of 504 single family homes were sold in the San Jose area. This indicates a .98% percent decrease over sales in September in 2016 with 509 home sales.
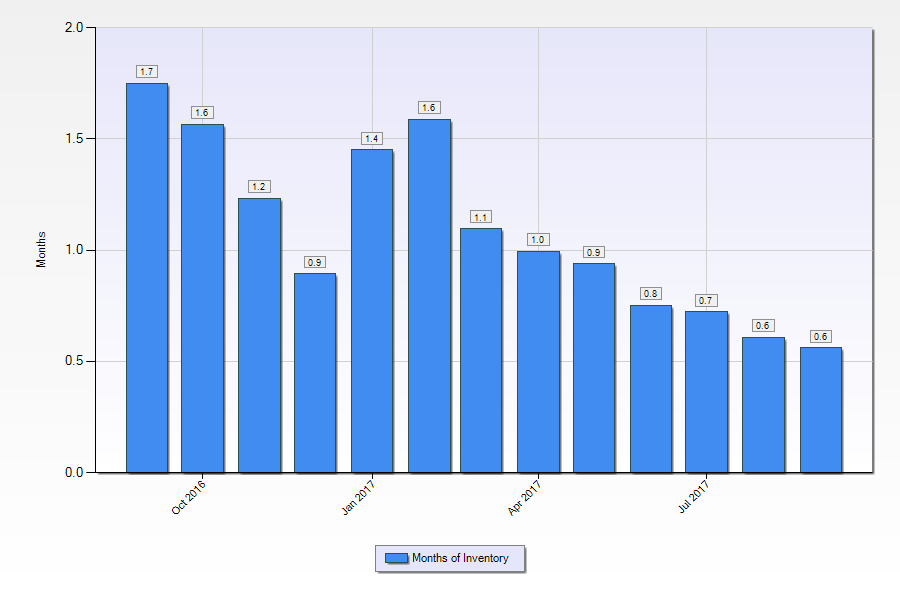
San Jose Real Estate Market Update Absorption Rate
If we look at the absorption rate which shows how fast all the homes currently on the market would sell if no other homes came up for sale, it shows that there is only .6 months of supply which is indicative of a very hot real estate market.
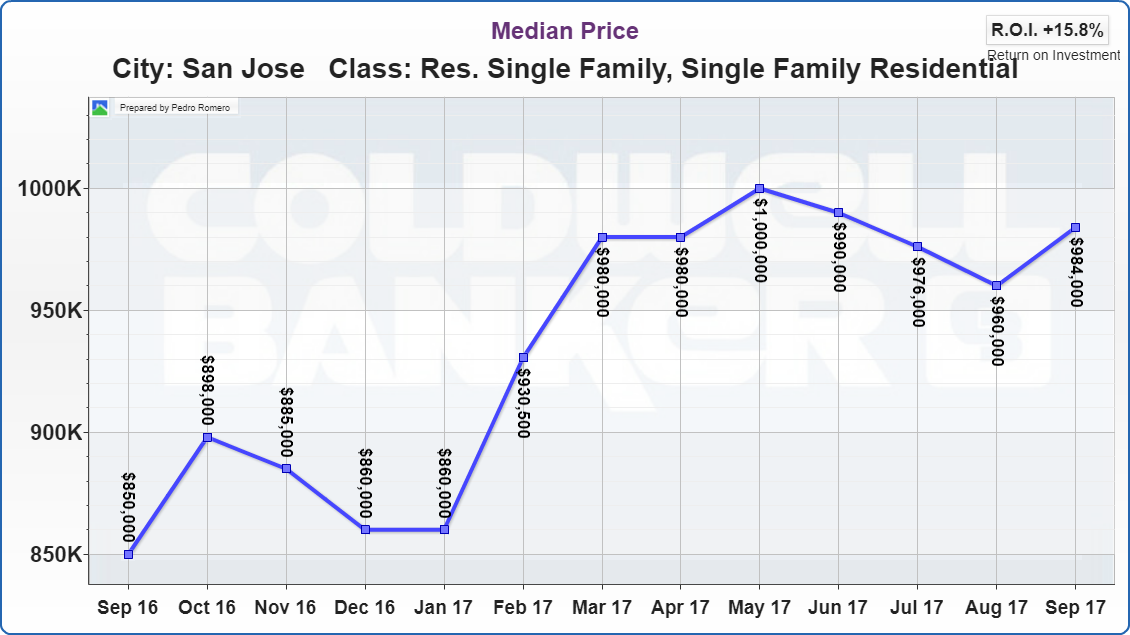
San Jose Real Estate Market Update Median Price
Prices in the San Jose real estate market continued to climb during that year-long period. The median price of a single-family home in the San Jose area increased 15.76% percent between $850,000 in September 2016 to $984,000 in September 2017.
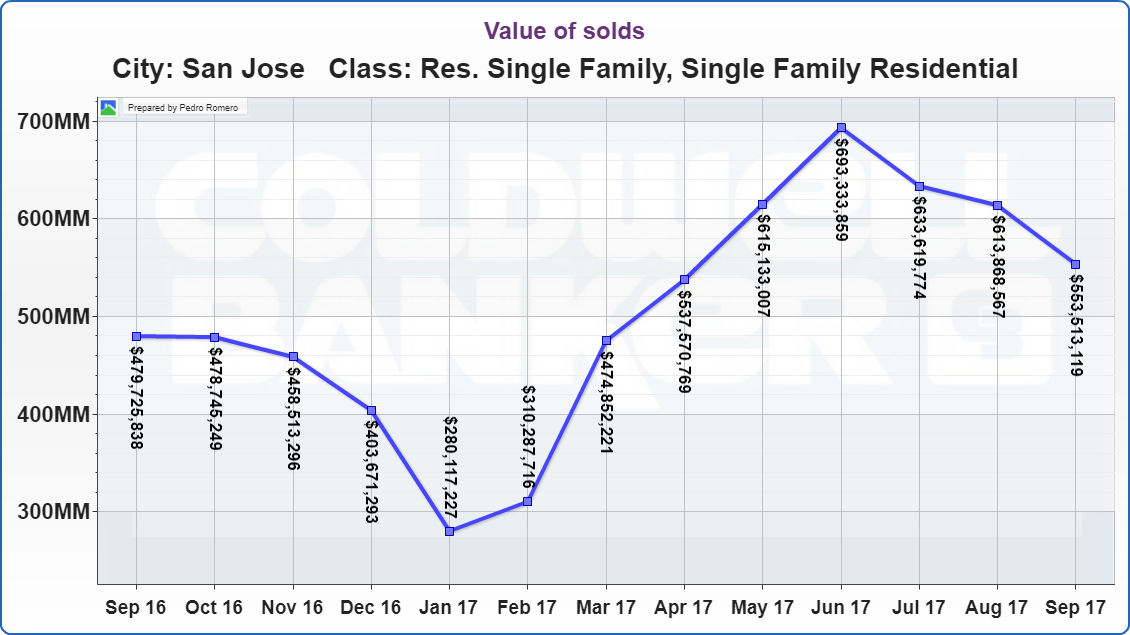
San Jose Real Estate Market Update Dollar Volume Of Sales
The dollar volume of sales year over year increased 15.38 percent.
In total, $553,513,119 worth of homes were sold in September 2017
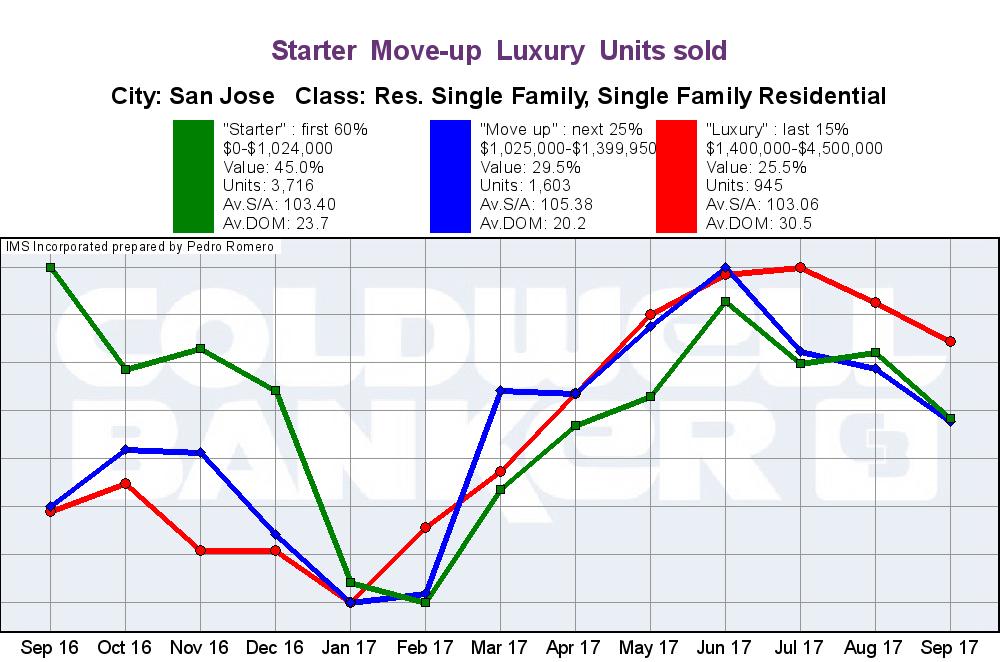
San Jose Real Estate Market Update Sales Trend
If we look at the trend, you’ll see that in September 2016 “Starter” home sales were well above “Luxury” & “Move Up” Homes, which caused the number of home sales to go up. In September 2017 “Luxury” Home sales are well above Starter & Move Up home sales resulting in an increase of the median price, & dollar volume of sales. For more information about “Starter”, “Move Up” & “Luxury” home sales such as maps, trends and sales prices be sure to read my latest blog San Jose Real Estate Market Update Value Range.
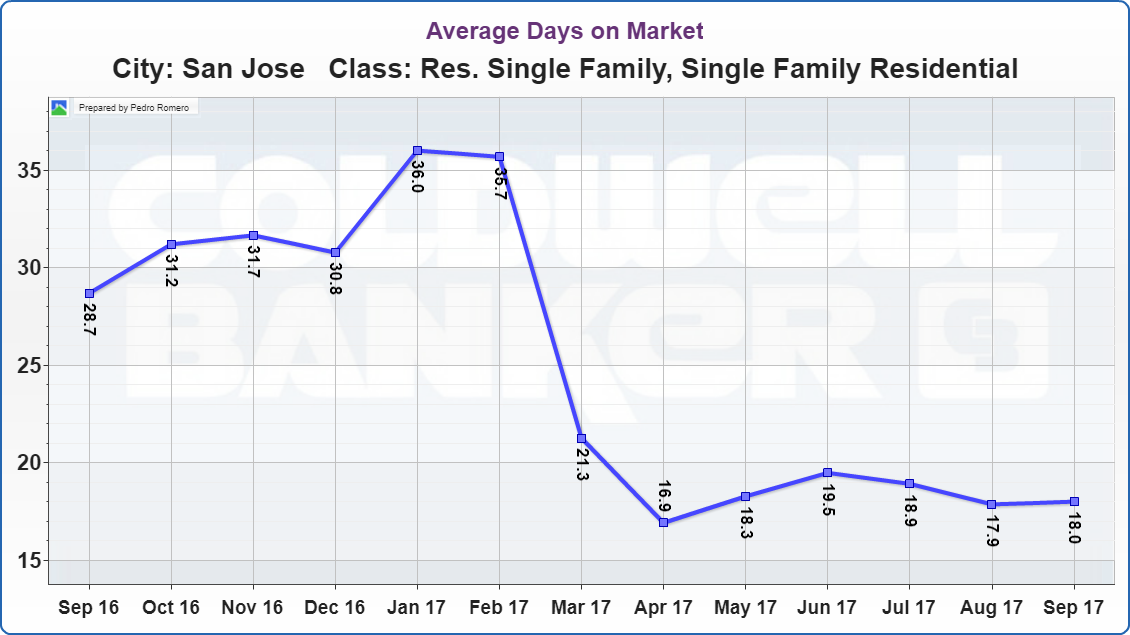
San Jose Real Estate Market Update Days On Market
Homes spend an average of 18 days on the market in San Jose, which is a dramatic decrease from the same as in September 2016 with 28.7 days.
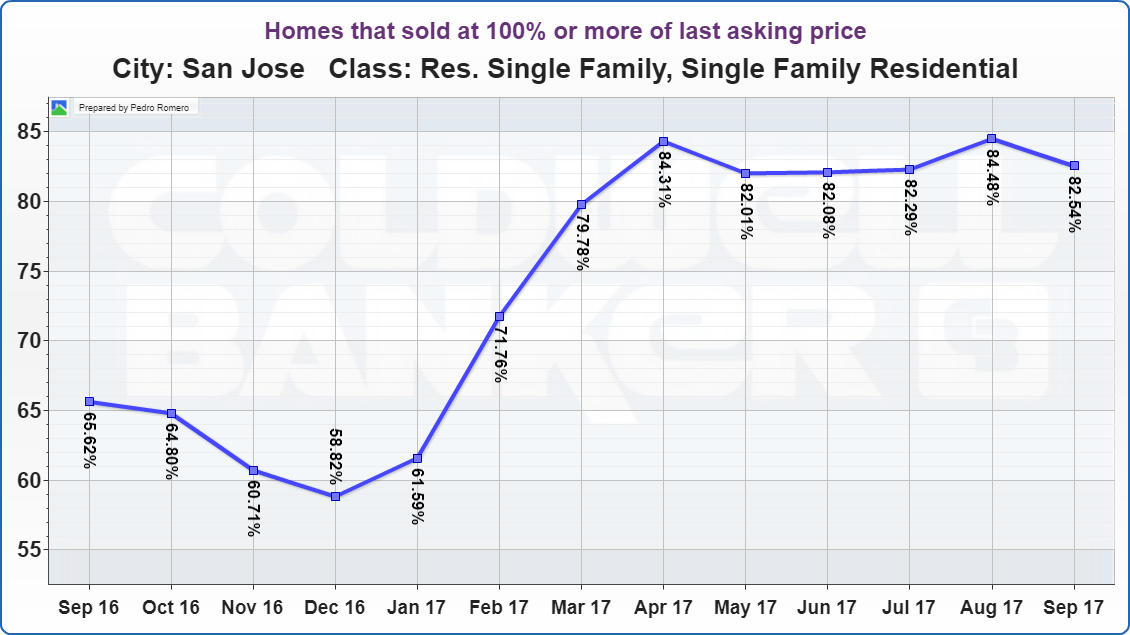
San Jose Real Estate Market Update Overbidding Percentage
82.54% percent of homes that sold, sold for their asking price or above. This reflects a 25.79% percent increase over the same time last year.
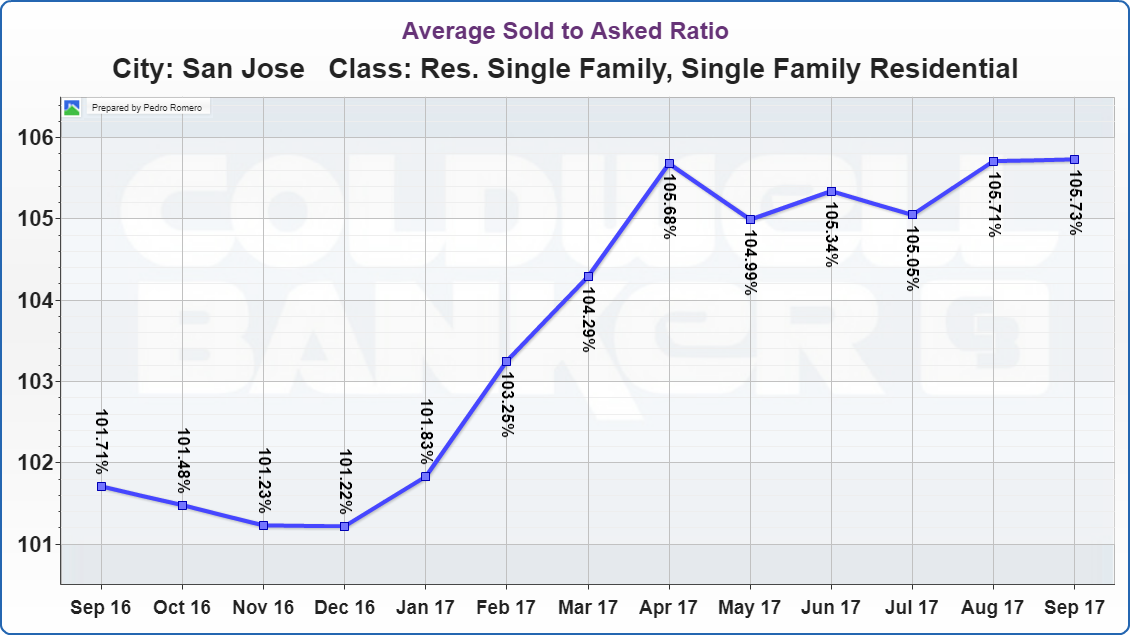
San Jose Real Estate Market Update Sold Price To List Price Ratio
Generally high prices, limited availability, and quick sales of those homes that come up for sale make the San Jose real estate market a favorable environment for Sellers.
With the average sales price to list price ratio of 105.73 percent, assuming the home is priced right, sellers can expect to sell their home for at least 5.73% above the list price.
At the same time buyers can expect to pay at least 5.73% more than a home’s list price.
Coldwell Banker The Professional Group provides expert real estate services to residential buyers and sellers in San Jose and surrounding communities.
To get a free home value evaluation or to discuss the sale of your home call us at (408) 482-5064, there’s no obligation to list your home when you call.
For additional information about the overall real estate market such as interest rates, consumer confidence etc. click on the link below.
Real Estate With Pedro Romero
Glossary of Terms
Average Days On Market (DOM): The average marketing time it has taken properties to sell.
Median Price: Sale Price that is midway between the least expensive and most expensive properties. Half of the properties sold for more than the median price and half the properties sold for less than the median price.
Months Of Inventory: The amount of time it would take to sell all current listings at the current sales pace if no new listings became available. Number of active OR pending(ie: on market) listings for the month / Number of closed sales for the month.
Sales Price to List Price Ratio: The percentage of the list price that buyers ultimately paid for the property.