San Jose Real Estate Market Update December 2017
In this blog post, Pedro M Romero, Coldwell Banker The Professional Group describes the San Jose Real Estate Market Update for December 2017.
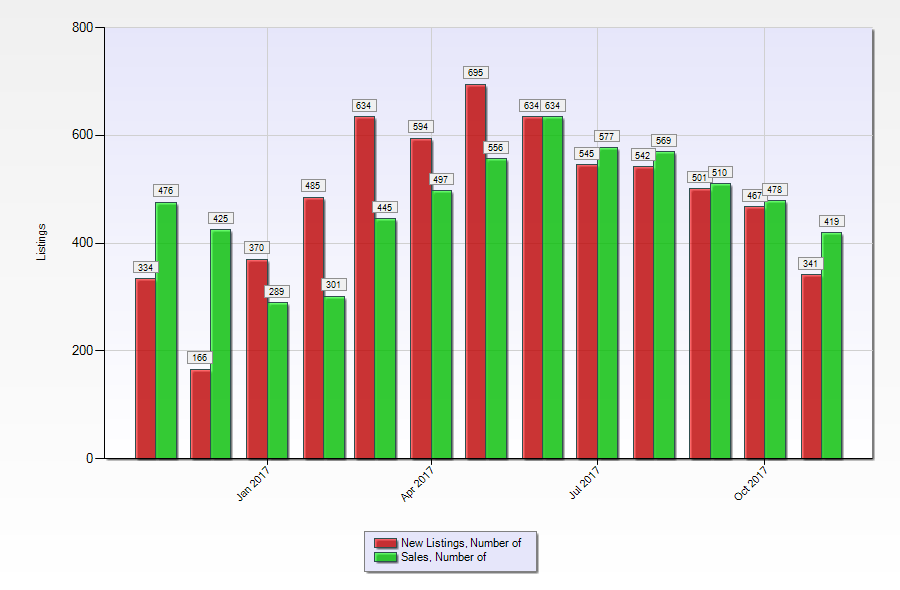
In the San Jose real estate market, conditions continue to favor sellers, even as more houses become available compared to this time last year.
The 341 new listings in November 2017 represents an increase over November 2016 with 334 listings.
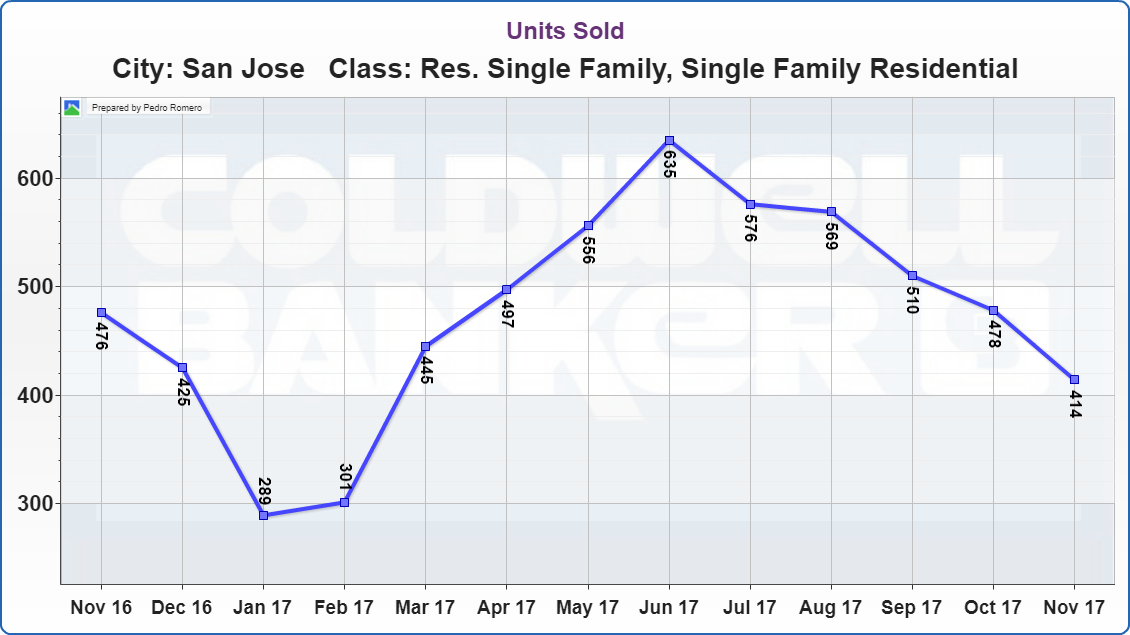
San Jose Real Estate Market Update Units Sold
The Multiple Listing Service reports that in November a total of 414
single family homes were sold in the San Jose area. This indicates a 13.03% percent decrease over sales in November in 2016 with 476 home sales.
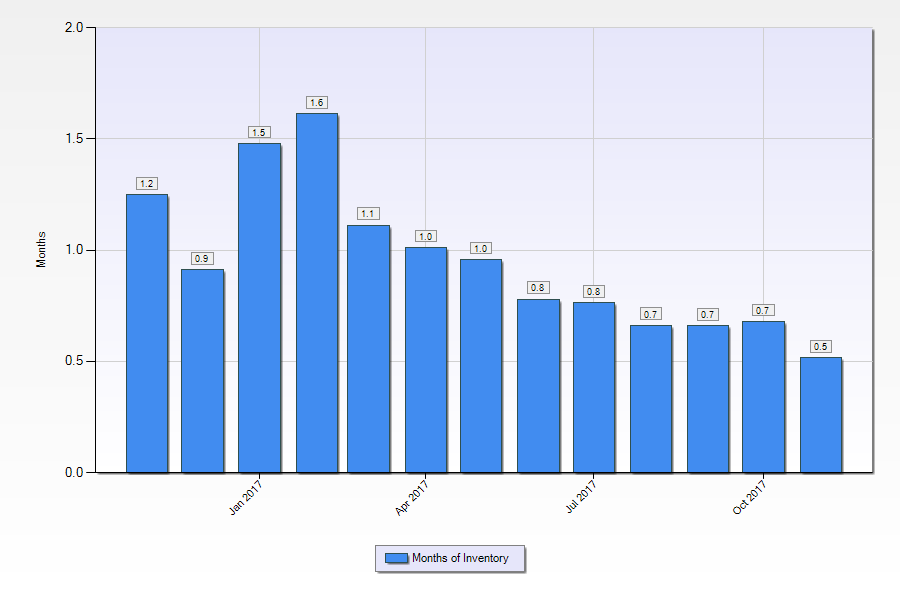
San Jose Real Estate Market Update Months Of Inventory
If we look at the absorption rate which shows how fast all the homes currently on the market would sell if no other homes came up for sale, it shows that there is only .5 months of supply which is indicative of a very hot real estate market.
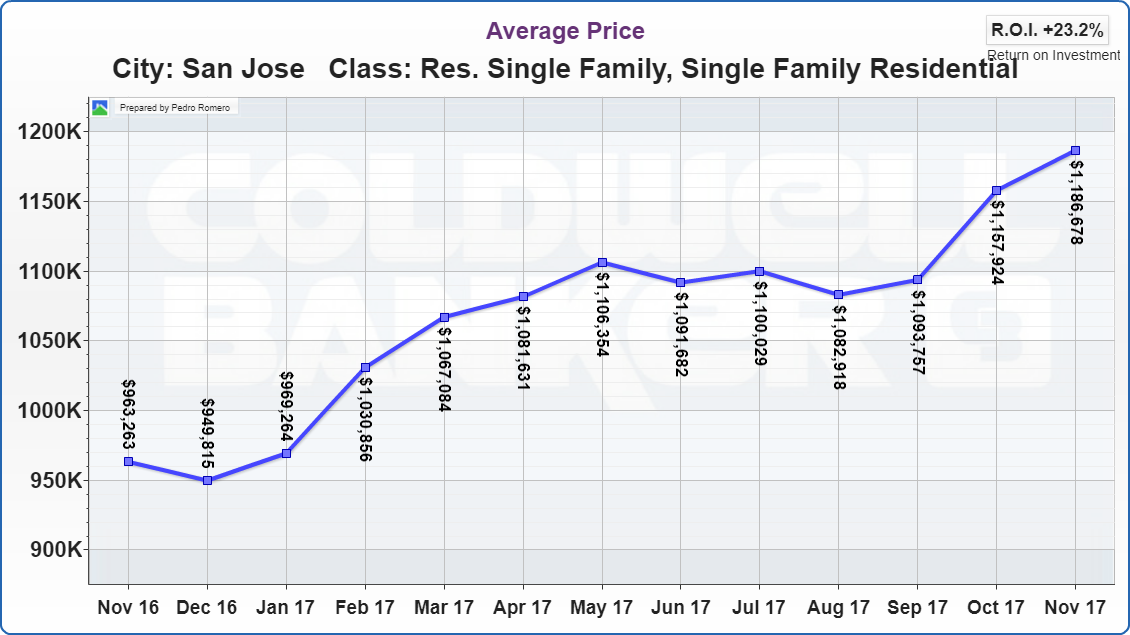
San Jose Real Estate Market Update Median Price
Prices in the San Jose real estate market continued to climb during that year-long period. The median price of a single-family home in the San Jose area increased 23.19% percent between $963,263 in November 2016 to $1,186,678 in November 2017.
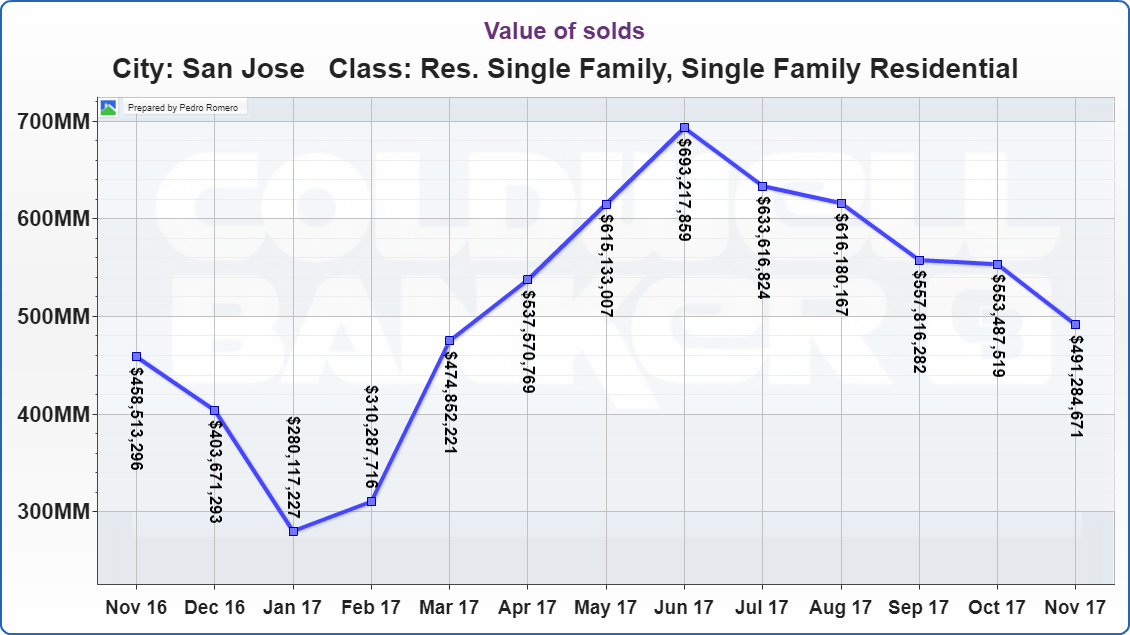
San Jose Real Estate Market Update Dollar Volume Of Sales
The dollar volume of sales year over year increased 7.15 percent.
In total, $491,284,671 worth of homes were sold in November 2017
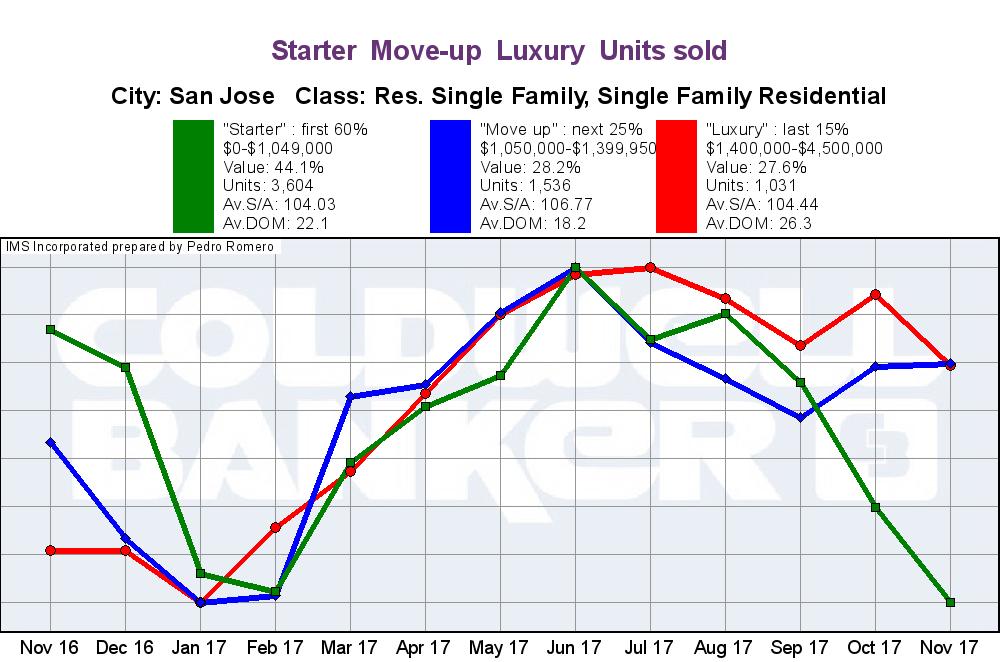
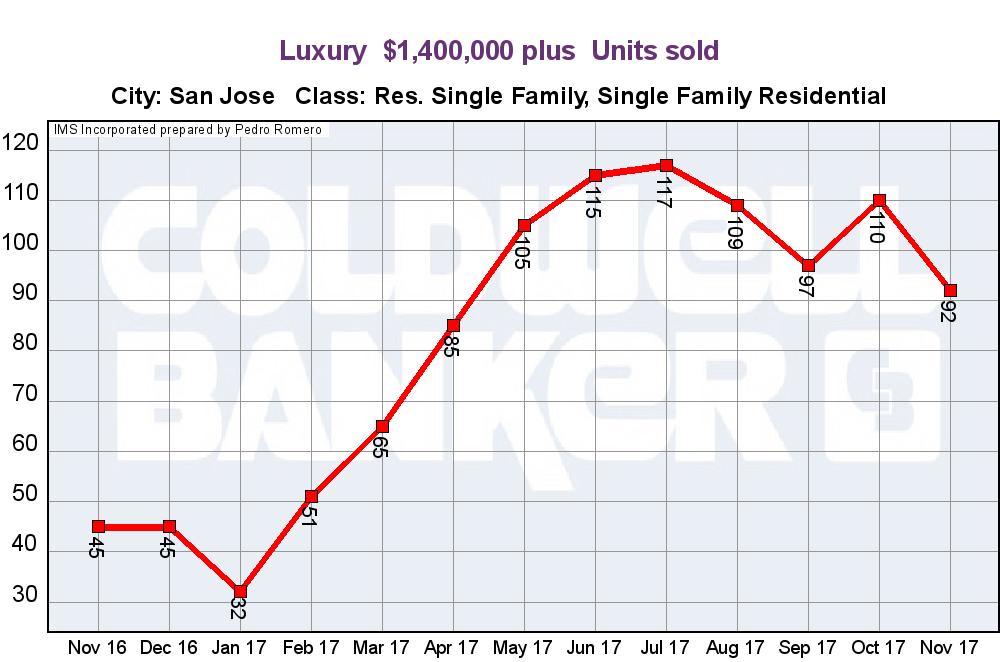
San Jose Real Estate Market Update Sales Trend
If we look at the trend, you’ll see that in November 2016 “Starter” home sales were well above “Luxury” & “Move Up” Homes, which caused the number of home sales to go up. In November 2017 “Luxury” & “Move Up” Home sales are well above “Starter” home sales resulting in an increase of the median price, & dollar volume of sales.
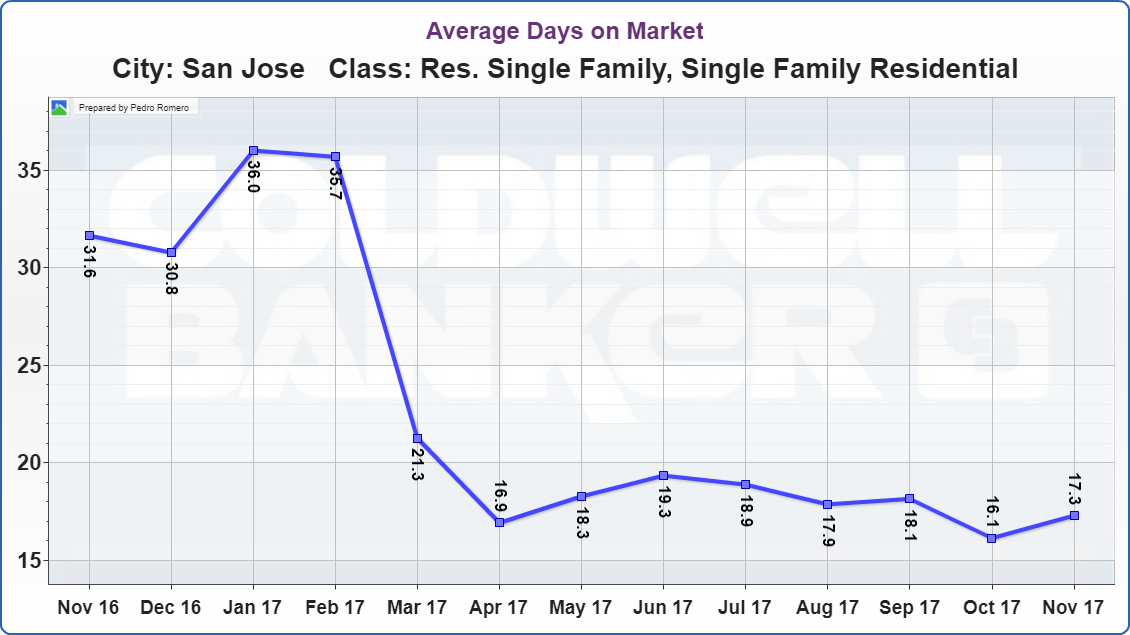
San Jose Real Estate Market Update Days On Market
Homes spend an average of 17.3 days on the market in San Jose, which is a dramatic decrease from the same as in November 2016 with 31.6 days.
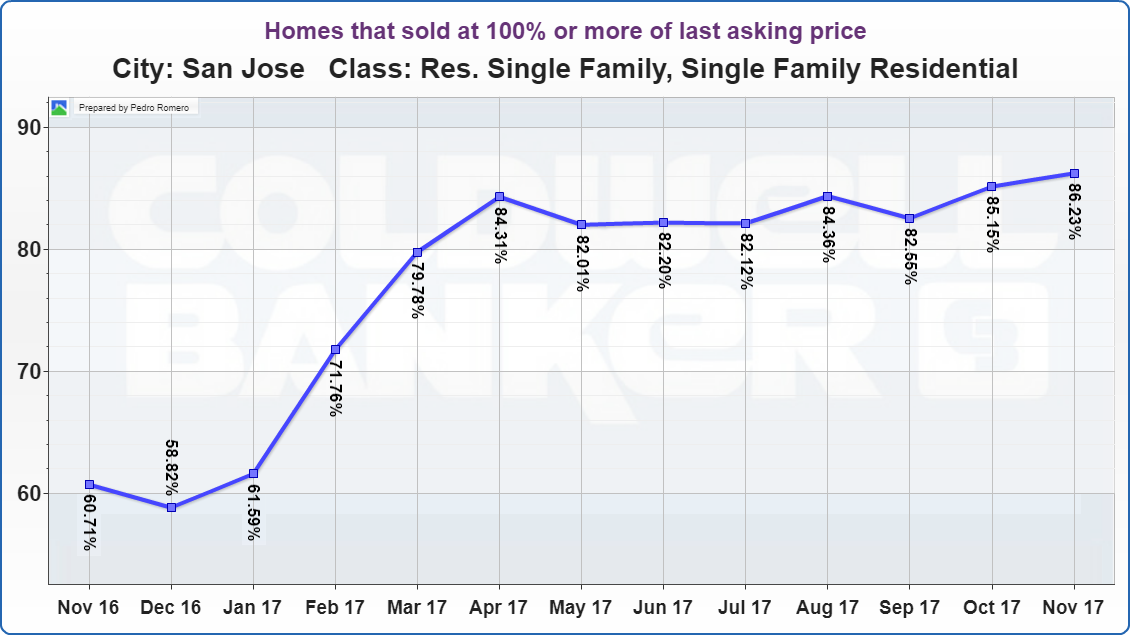
San Jose Real Estate Market Update Overbidding Percentage
86.23% percent of homes that sold, sold for their asking price or above. This reflects a 42.03% percent increase over the same time last year.
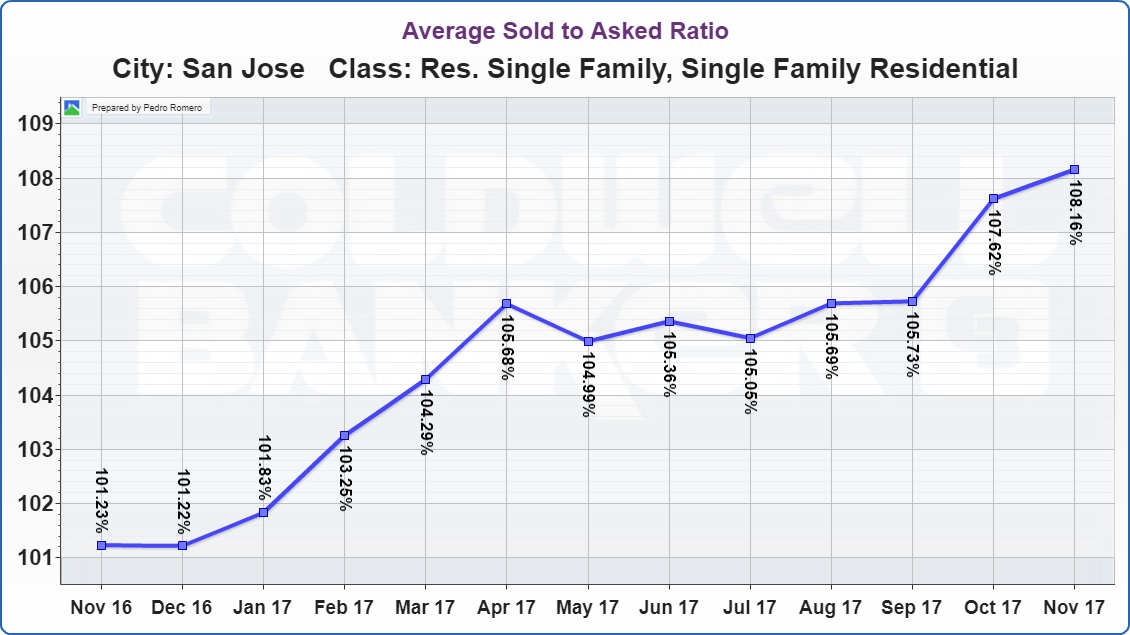
San Jose Real Estate Market Update Sold Price To List Price Ratio
Generally high prices, limited availability, and quick sales of those homes that come up for sale make the San Jose real estate market a favorable environment for Sellers.
With the average sales price to list price ratio of 108.16 percent, assuming the home is priced right, sellers can expect to sell their home for at least 8.16% above the list price.
At the same time buyers can expect to pay at least 8.16% more than a home’s list price.
Diving a little deeper into the San Jose Real Estate Market stats we come across Value Ranges. Value Ranges were invented by REality’s founder Leon d’Ancona in 1989 while working on his book “The Home Price Guide”. The formula proved that a “60%-25%-15%” breakdown is the right way to determine price value ranges in North America.
It works this way: We look at all home prices and divide them into the first 60% “starter” the next 25% “move-up” and the last 15% “luxury”. You will notice that usually, “luxury” represents only 15% of the units sold, but has 30% of the value in a given market.
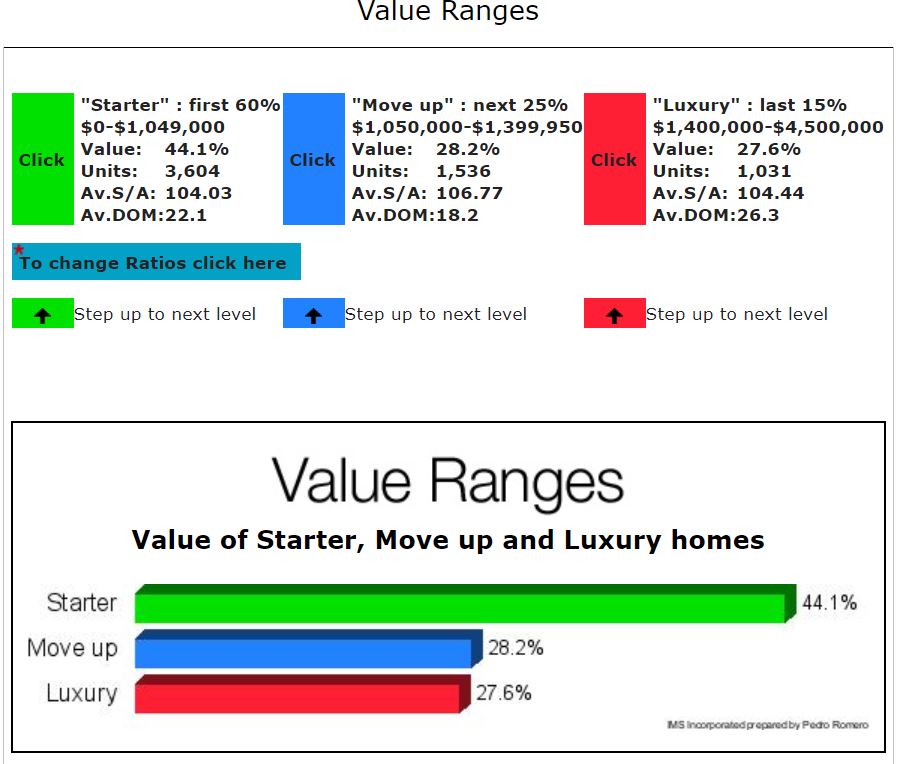
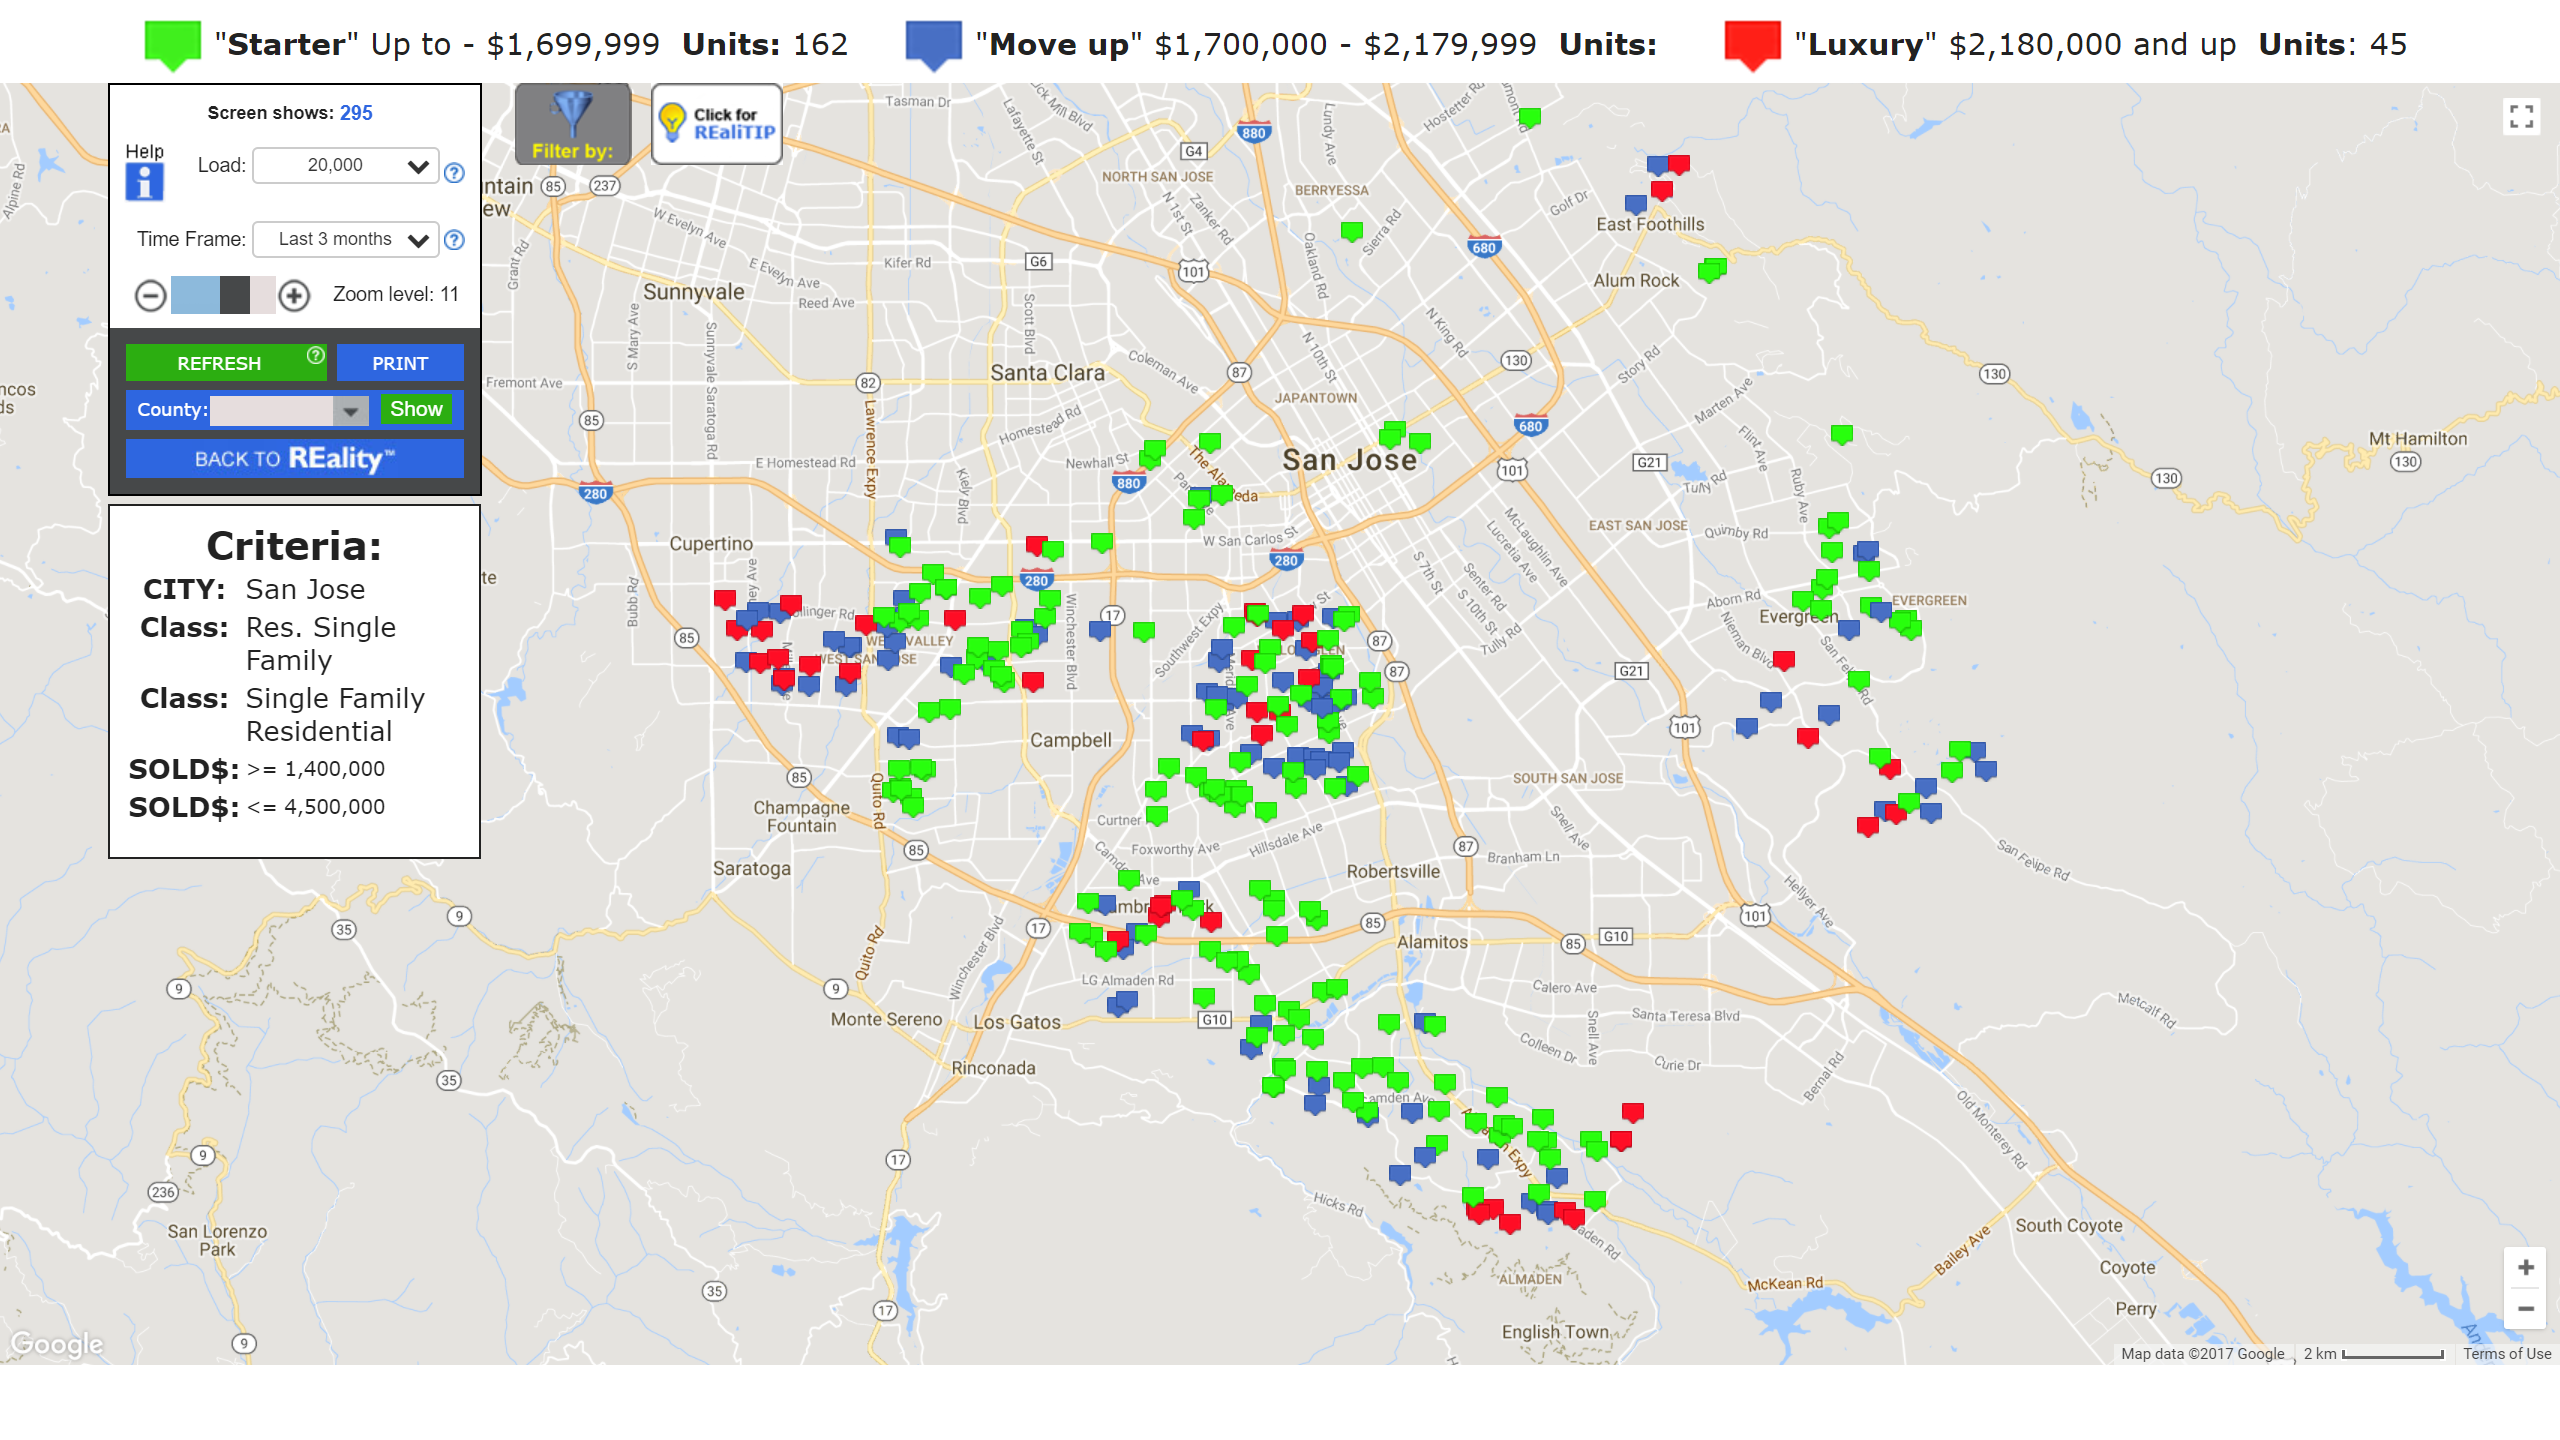
Overall Value Ranges in San Jose
Our Value Ranges begin with “Starter” homes, they range from $0-$1,049,00 which account for 44.1% of the value in the real estate market. Next is our “Move Up” which range from $1,050-$1,399,950, they make up 28.2% of the value in the real estate market. And last is our “Luxury” which are between $1,400,000-$4,500,000 which accounts for 27.6% of the value of the real estate market in San Jose.
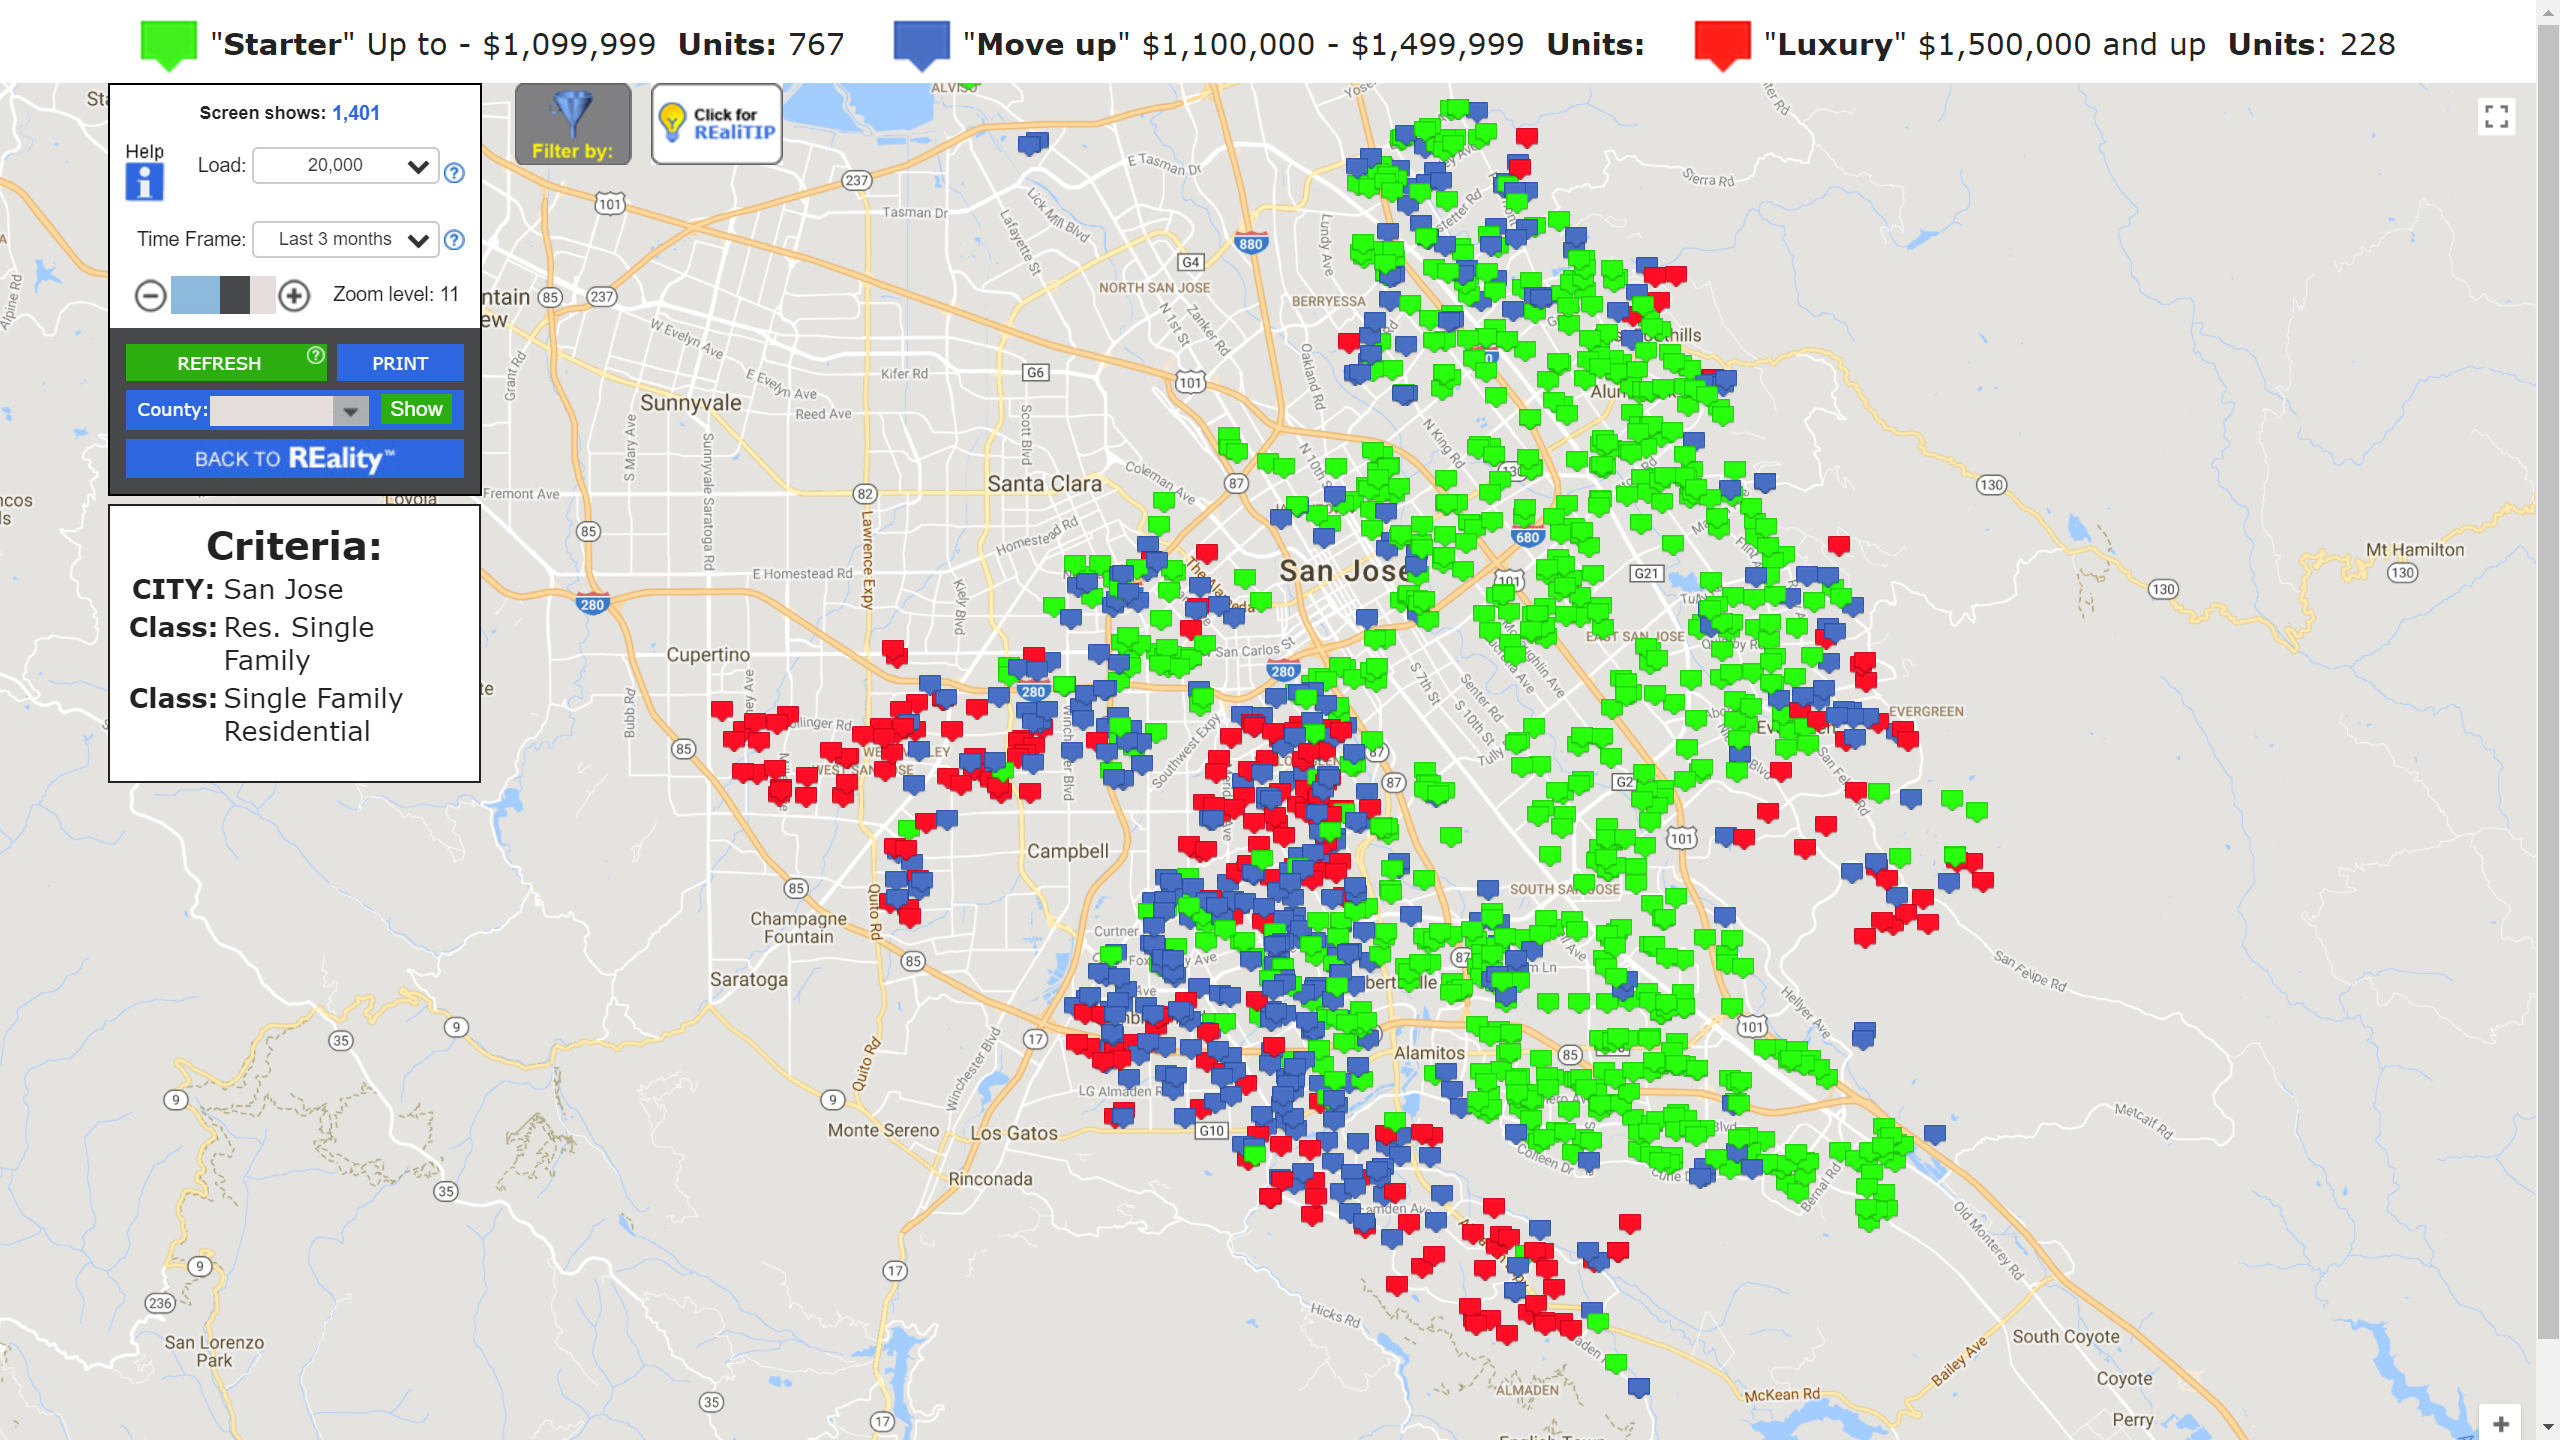
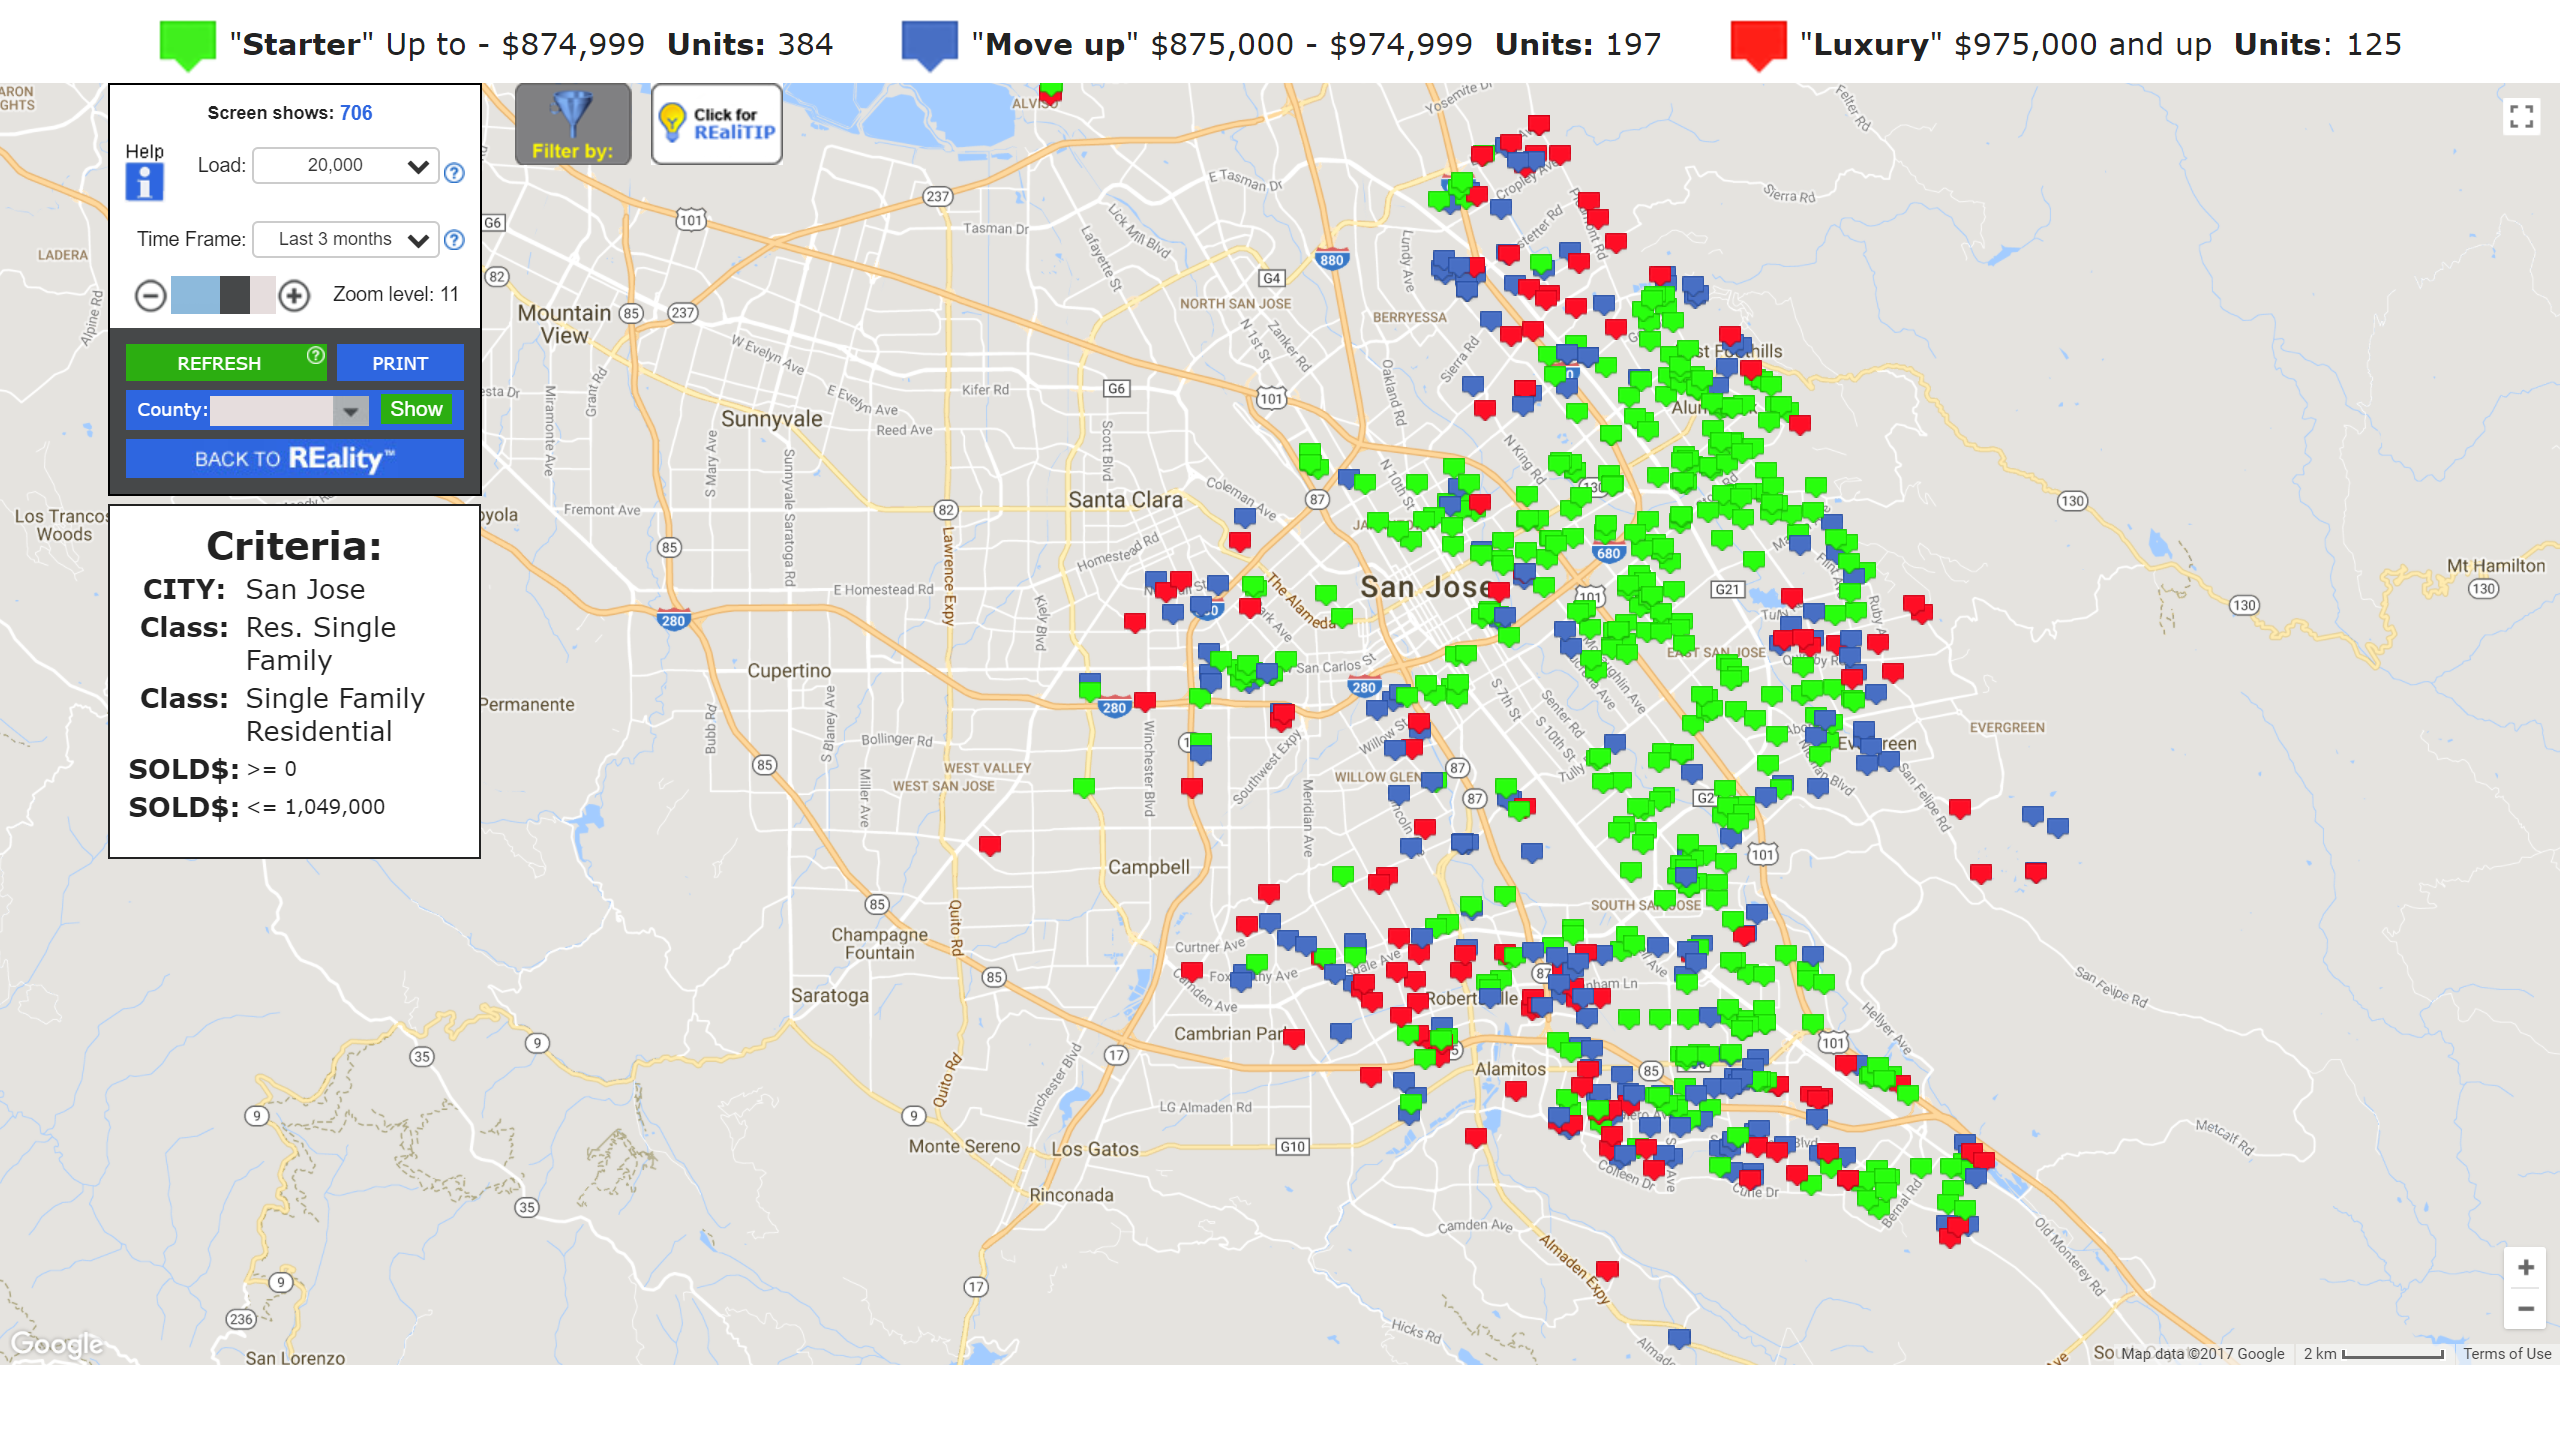
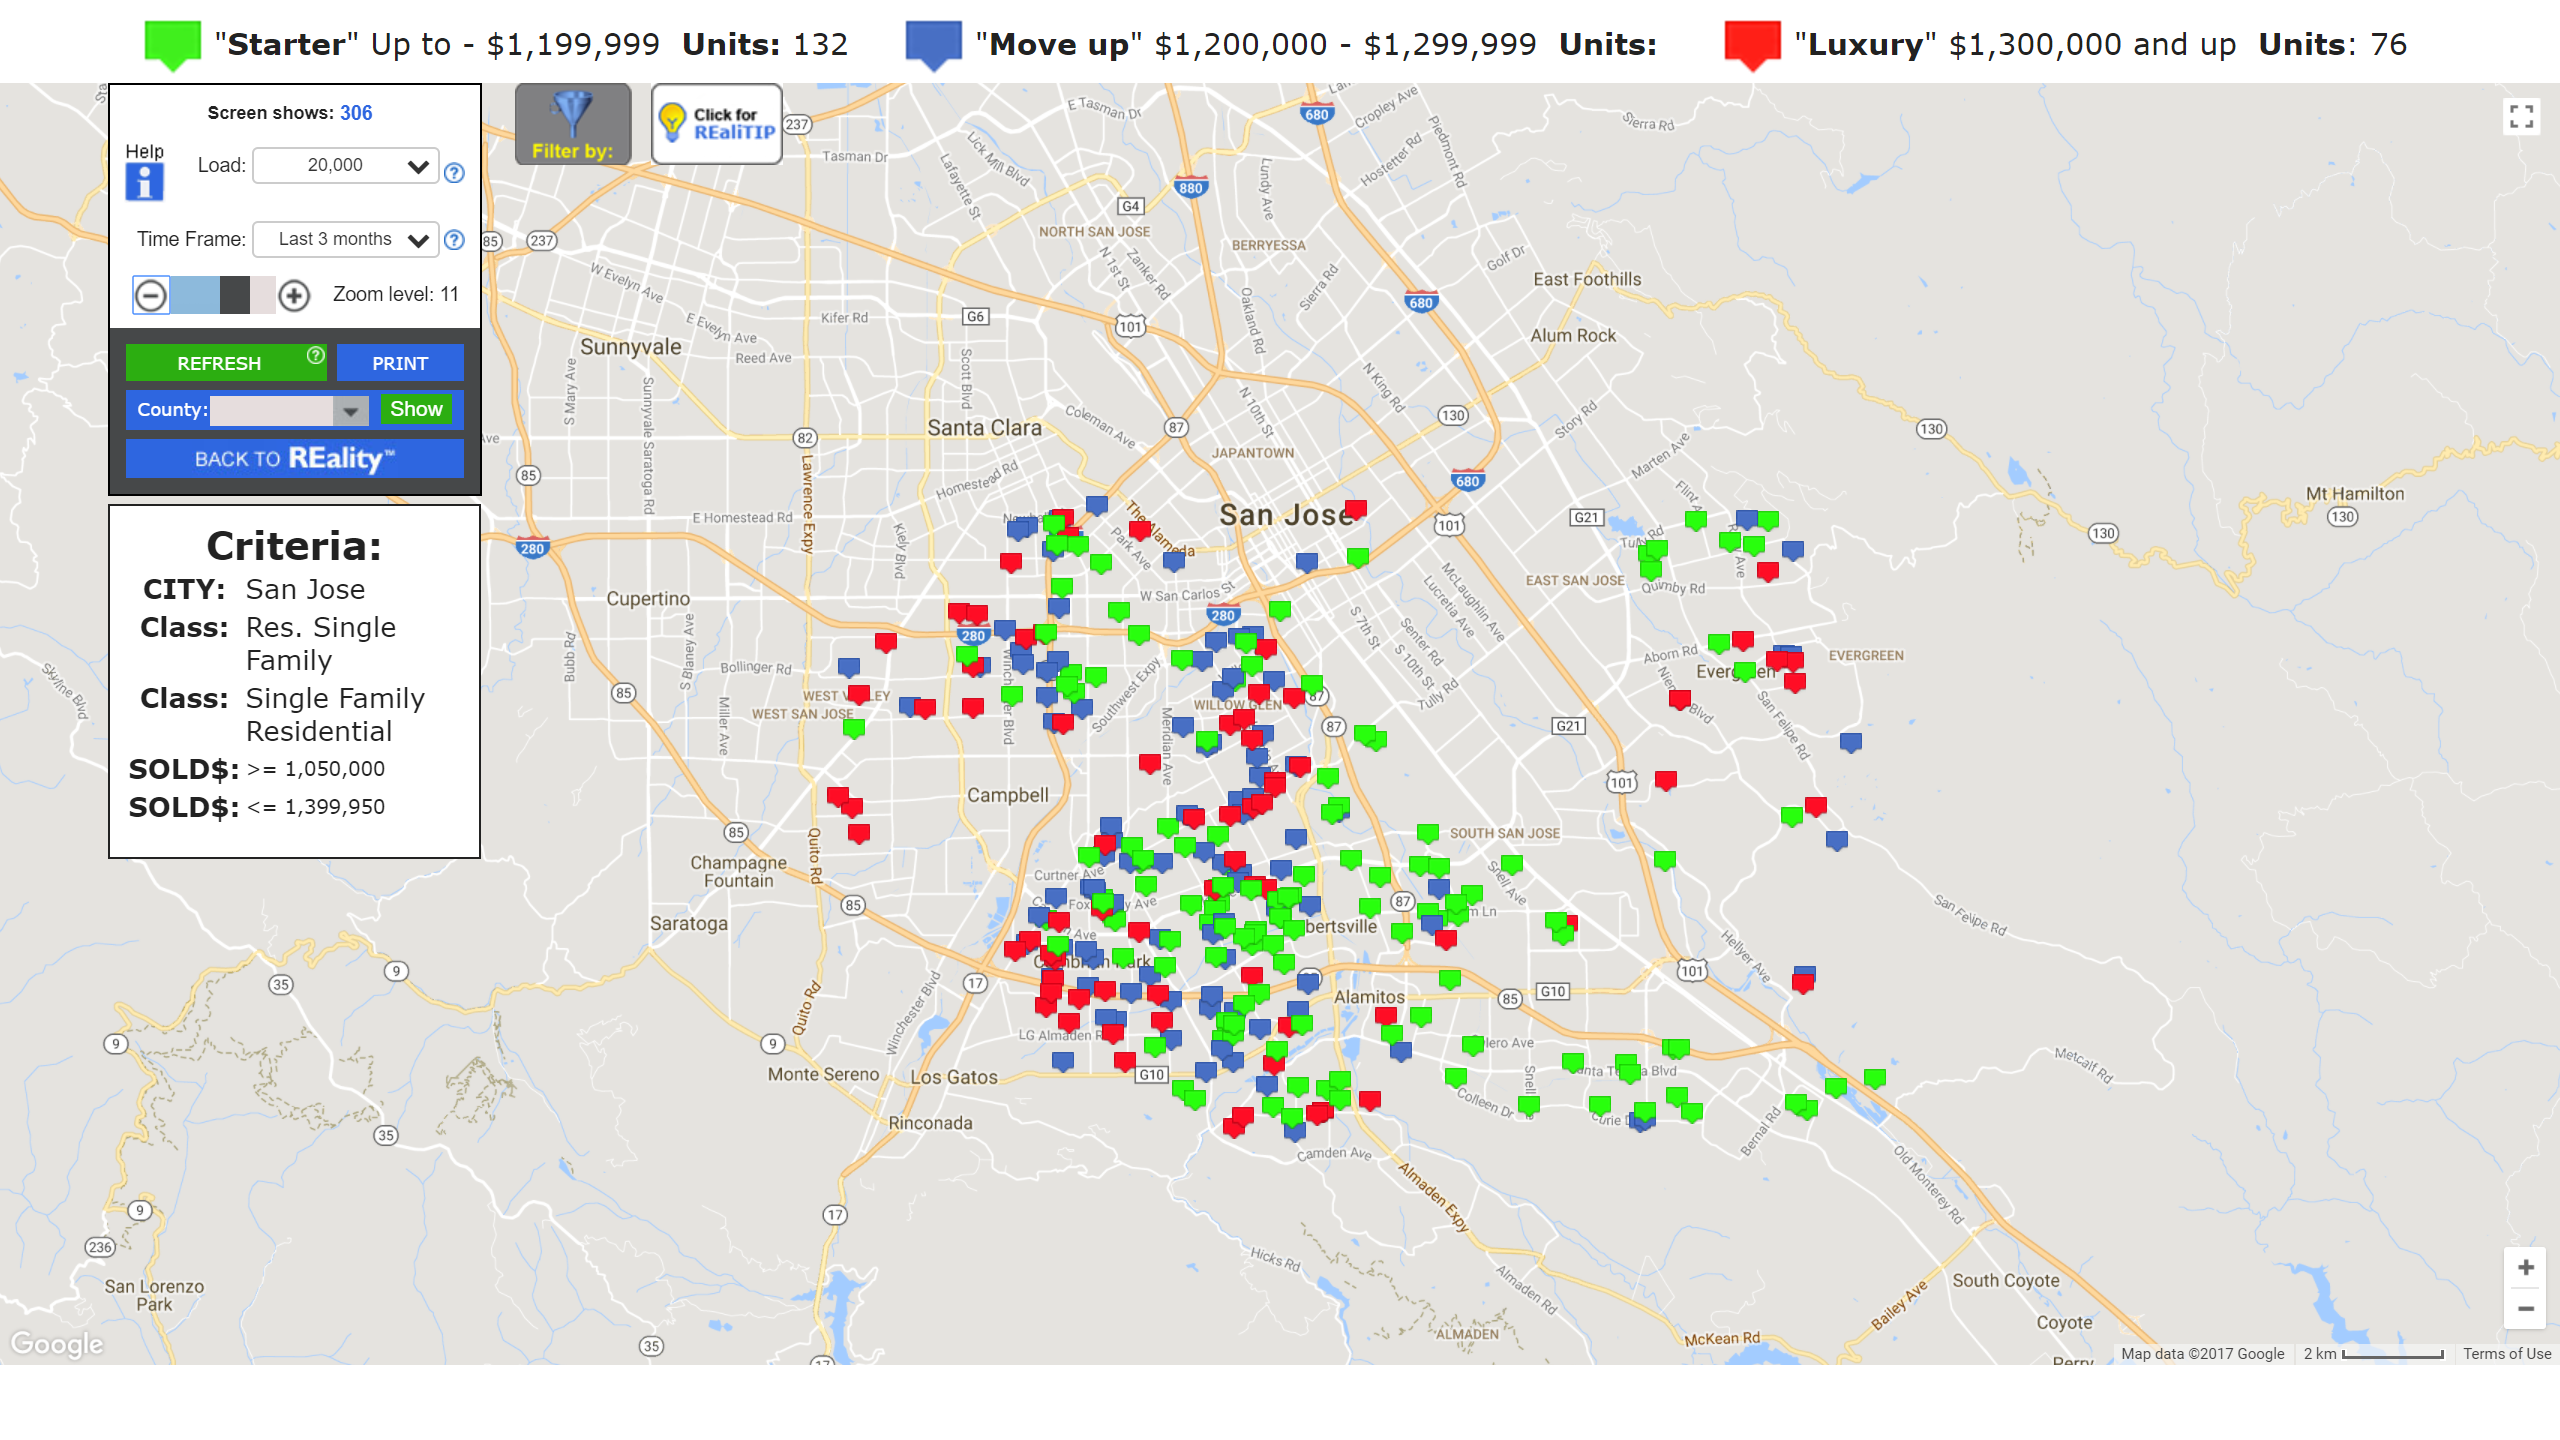
Below you’ll find a map showing the home sales in San Jose over the past 3 months broken down by starter, move up & luxury value ranges.
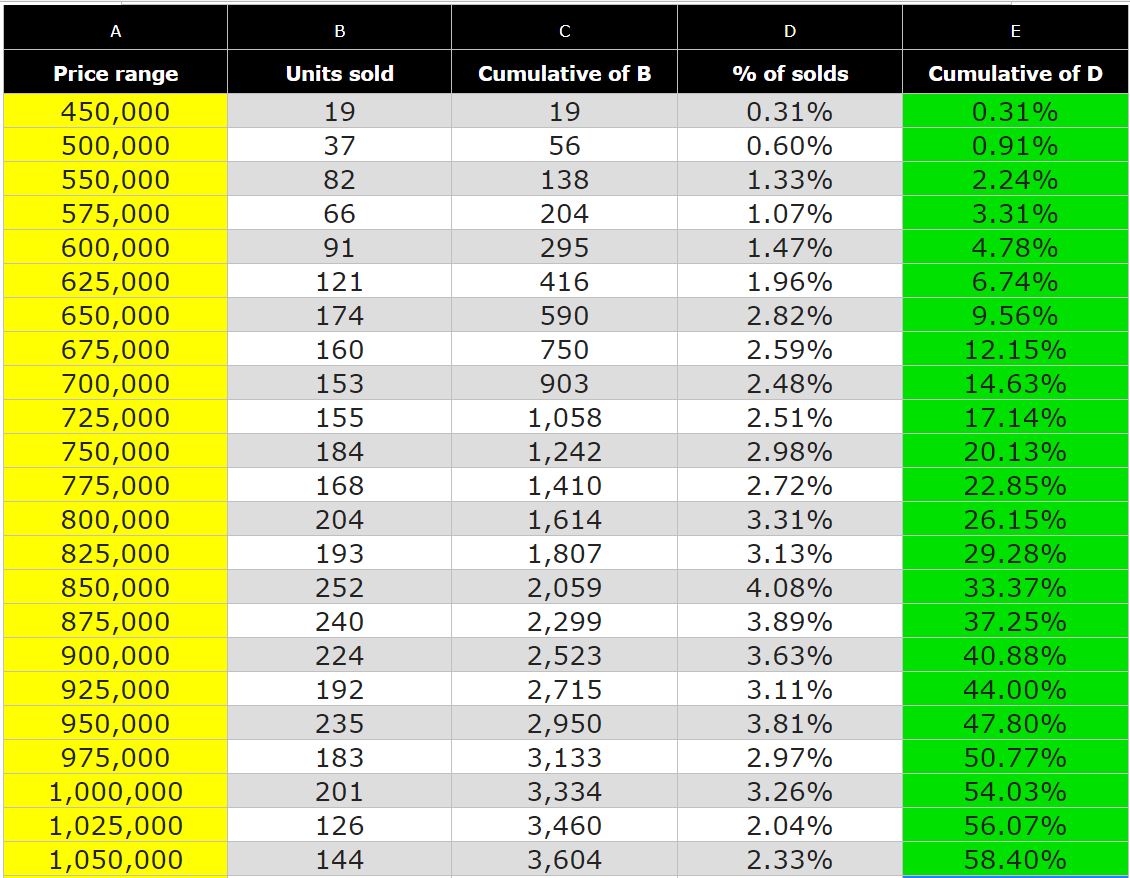
San Jose Real Estate Starter Value Range
Going deeper into the “Starter” homes the bottom ranges from $0-$849,000 and represents 51.4% of the value. The middle ranges from $850,000-$949,000 and makes up 28.2% of the value. Lastly, the top-level ranges from $950,000-$1,049,000 and accounts for 20.4% of the value in the “Starter Value Range”.
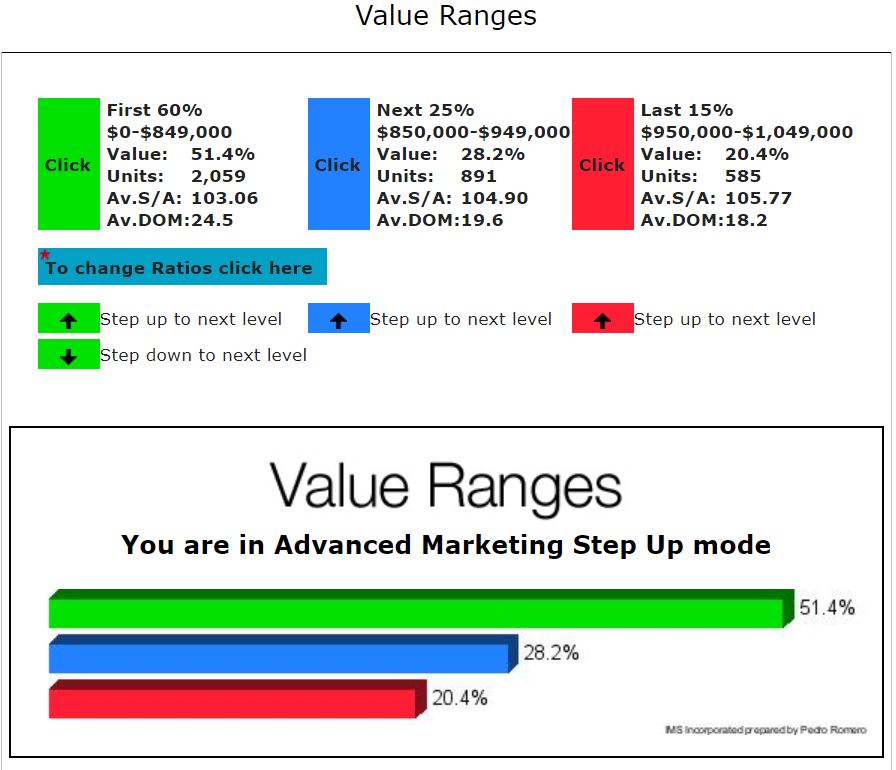
In November 2016 there were 319 “Starter” Home sales. Whereas in November 2017 there were 184 “Starter” Home sales.
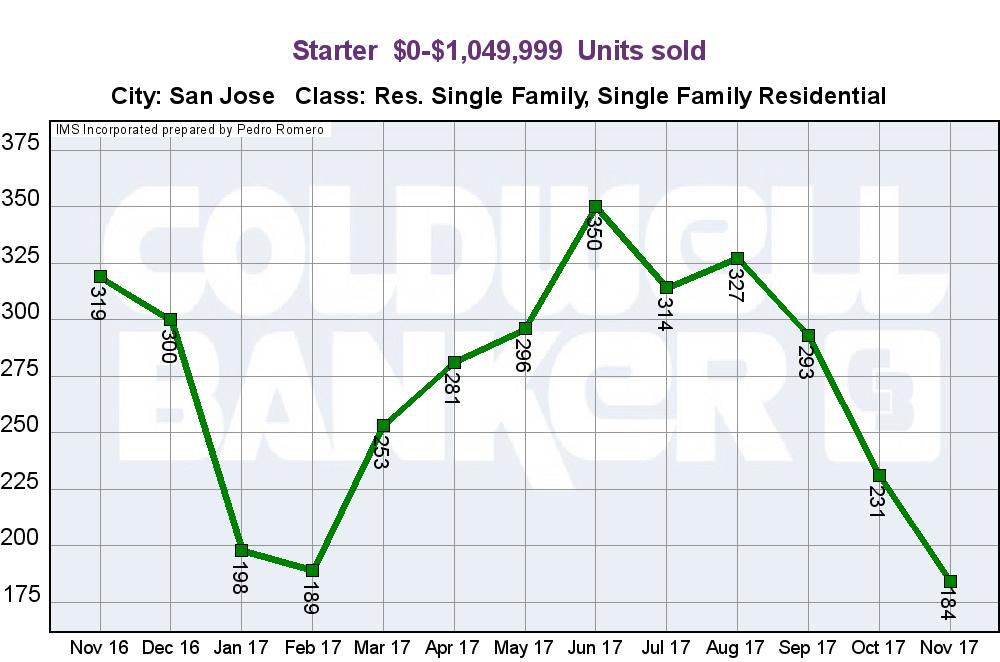
Below you’ll see a map of “Starter” home sales separated by starter, middle & top value range.
San Jose Real Estate Move Up Value Range
The Move Up Value Range starts with homes between $1,050,000-$1,223,00 and represents 54.7% of the value. The middle ranges from $1,225,000-$1,299,998 and makes up 23.7% of the value. The top-level ranges from $1,300,000-$1,399,950 and accounts for 21.6% of the value in the “Move Up Value Range”.
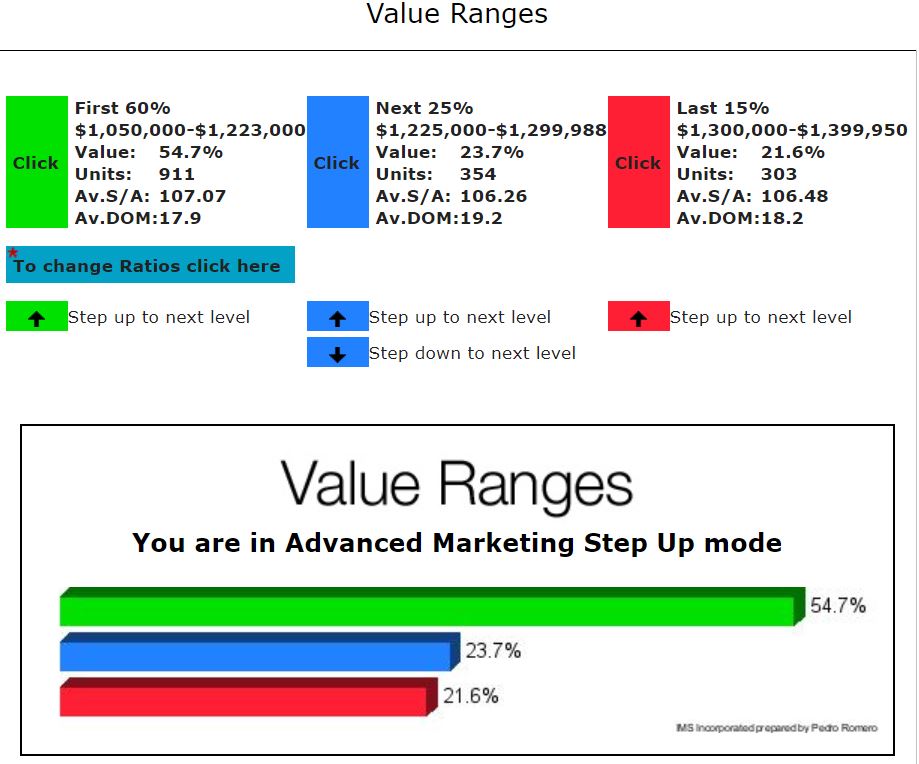
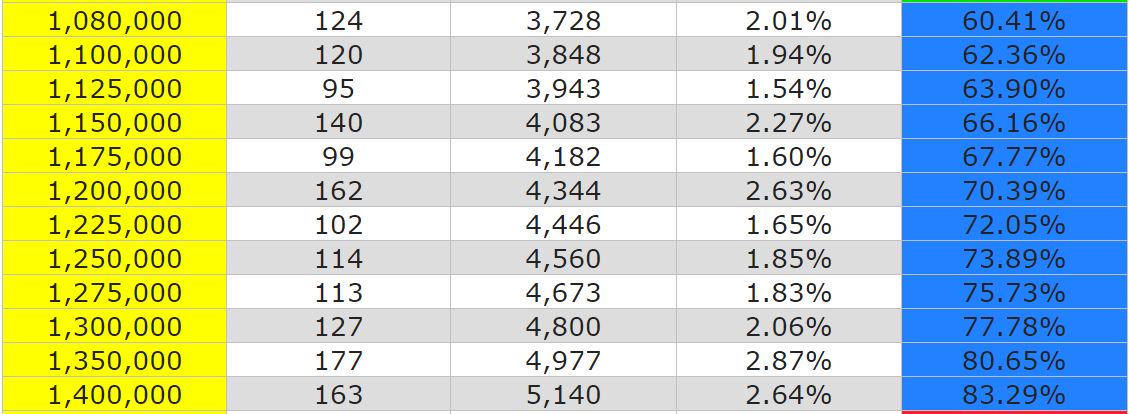
In November 2016 there were 112 “Move Up” Home sales. Whereas in November 2017 there were 138 “Move Up” Home sales.
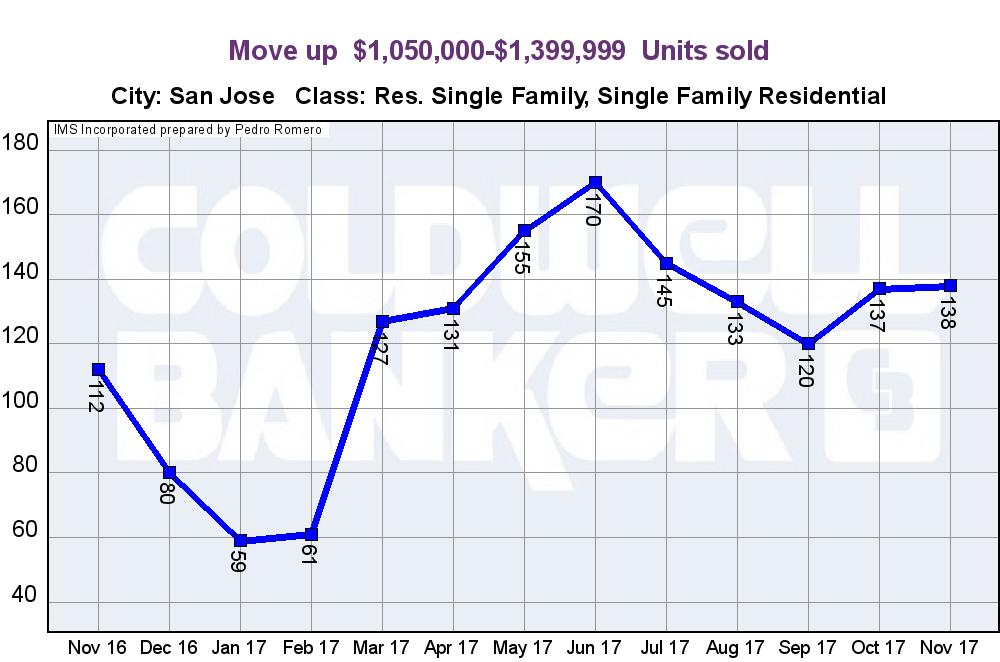
Below you’ll see a map of “Move Up” home sales separated by starter, middle & top value range.
San Jose Real Estate Luxury Value Range
The Luxury Value Range Starter starts with homes between $1,400,000-$1,720,000 and represents 51.8% of the value. The middle ranges from $1,725,000-$2,080,000 and makes up 26.9% of the value. Lastly, the top-level ranges between $2,085,000-$4,500,000 and accounts for 21.3% of the value in the “Luxury Value Range”.
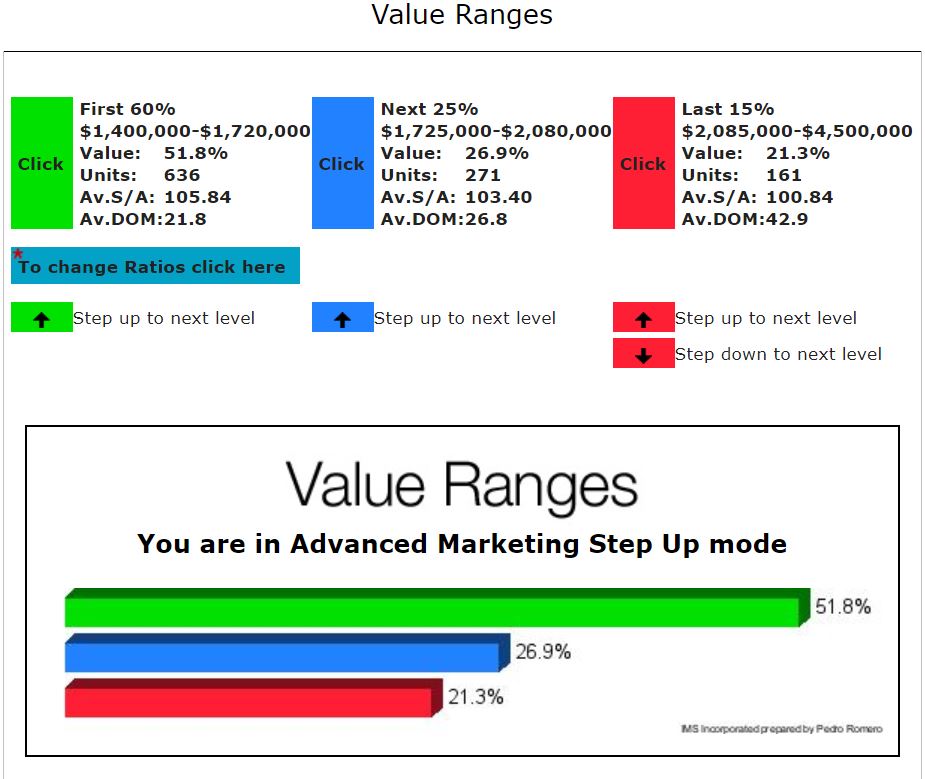
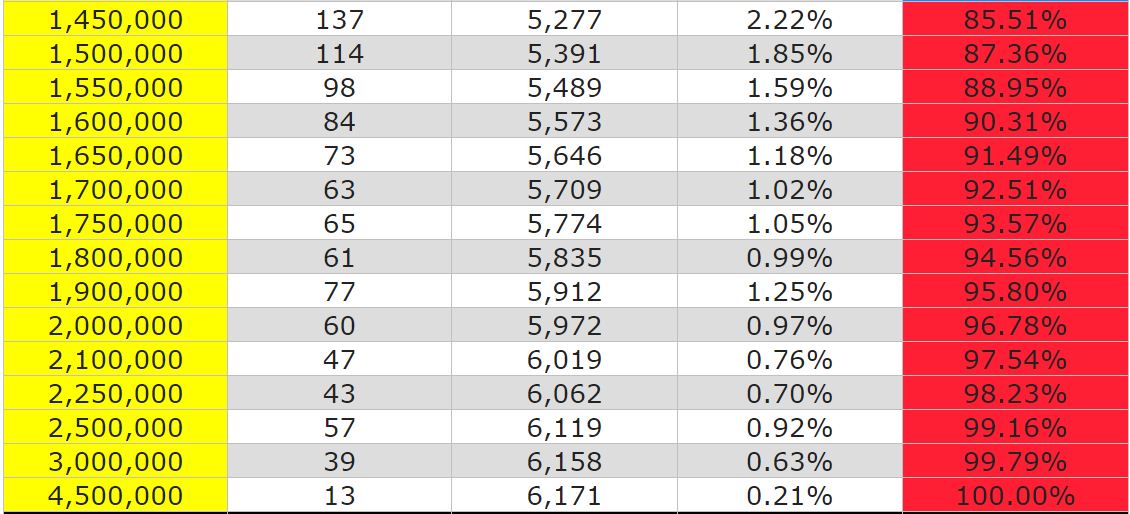
In November 2016 there were 45 “Luxury” Home sales. Whereas in November 2017 there were 92 “Luxury” Home sales.
Below you’ll see a map of “Luxury” home sales separated by starter, middle & top value range.
Coldwell Banker The Professional Group provides expert real estate services to residential buyers and sellers in San Jose and surrounding communities.
To get a free home value evaluation or to discuss the sale of your home call us at (408) 482-5064, there’s no obligation to list your home when you call.
For additional information about the overall real estate market such as interest rates, consumer confidence etc. click on the link below.
Real Estate With Pedro Romero
Glossary of Terms
Average Days On Market (DOM): The average marketing time it has taken properties to sell.
Median Price: Sale Price that is midway between the least expensive and most expensive properties. Half of the properties sold for more than the median price and half the properties sold for less than the median price.
Months Of Inventory: The amount of time it would take to sell all current listings at the current sales pace if no new listings became available. The number of active OR pending(ie: on market) listings for the month / Number of closed sales for the month.
Sales Price to List Price Ratio: The percentage of the list price that buyers ultimately paid for the property.